MetLife 2005 Annual Report Download - page 123
Download and view the complete annual report
Please find page 123 of the 2005 MetLife annual report below. You can navigate through the pages in the report by either clicking on the pages listed below, or by using the keyword search tool below to find specific information within the annual report.-
 1
1 -
2
-
3
-
4
-
5
-
6
-
7
-
8
-
9
-
10
-
11
-
12
-
13
-
14
-
15
-
16
-
17
-
18
-
19
-
20
-
21
-
22
-
23
-
24
-
25
-
26
-
27
-
28
-
29
-
30
-
31
-
32
-
33
-
34
-
35
-
36
-
37
-
38
-
39
-
40
-
41
-
42
-
43
-
44
-
45
-
46
-
47
-
48
-
49
-
50
-
51
-
52
-
53
-
54
-
55
-
56
-
57
-
58
-
59
-
60
-
61
-
62
-
63
-
64
-
65
-
66
-
67
-
68
-
69
-
70
-
71
-
72
-
73
-
74
-
75
-
76
-
77
-
78
-
79
-
80
-
81
-
82
-
83
-
84
-
85
-
86
-
87
-
88
-
89
-
90
-
91
-
92
-
93
-
94
-
95
-
96
-
97
-
98
-
99
-
100
-
101
-
102
-
103
-
104
-
105
-
106
-
107
-
108
-
109
-
110
-
111
-
112
-
 113
113 -
 114
114 -
 115
115 -
 116
116 -
 117
117 -
 118
118 -
 119
119 -
 120
120 -
 121
121 -
 122
122 -
 123
123 -
 124
124 -
 125
125 -
 126
126 -
 127
127 -
 128
128 -
 129
129 -
 130
130 -
 131
131 -
 132
132 -
 133
133
 |
 |

METLIFE, INC.
NOTES TO CONSOLIDATED FINANCIAL STATEMENTS — (Continued)
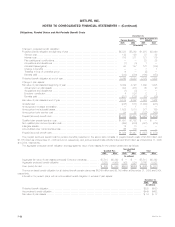
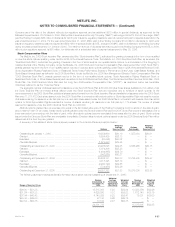
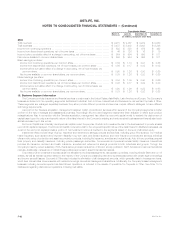
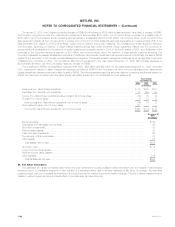
16. Earnings Per Common Share
The following presents the weighted average shares used in calculating basic earnings per common share and those used in calculating diluted
earnings per common share for each income category presented below:
Years Ended December 31,
2005 2004 2003
(In millions, except share and per share data)
Weighted average common stock outstanding for basic earnings per common share 749,022,816 750,924,982 738,597,047
Incremental shares from assumed:
Conversion of forward purchase contracts *********************************** — — 8,293,269
Exercise of stock options************************************************** 6,139,695 4,053,813 68,111
Issuance under LTPCP**************************************************** 173,845 — —
Weighted average common stock outstanding for diluted earnings per common share 755,336,356 754,978,795 746,958,427
Income from continuing operations *************************************** $ 3,139 $ 2,637 $ 1,829
Charge for conversion of company-obligated mandatorily redeemable
securities of a subsidiary trust(1) *************************************** ——21
Income from continuing operations per common share ******************** $ 3,139 $ 2,637 $ 1,808
Basic ****************************************************************** $ 4.19 $ 3.51 $ 2.45
Diluted ***************************************************************** $ 4.16 $ 3.49 $ 2.42
Income from discontinued operations, net of income taxes, per common
share****************************************************************** $ 1,575 $ 207 $ 414
Basic ****************************************************************** $ 2.10 $ 0.28 $ 0.56
Diluted ***************************************************************** $ 2.09 $ 0.27 $ 0.55
Cumulative effect of a change in accounting, net of income taxes, per
common share ******************************************************** $ — $ (86) $ (26)
Basic ****************************************************************** — $ (0.11) $ (0.04)
Diluted ***************************************************************** $ — $ (0.11) $ (0.03)
Net income available to common shareholders per common share ********* $ 4,651 $ 2,758 $ 2,196
Basic ****************************************************************** $ 6.21 $ 3.67 $ 2.97
Diluted ***************************************************************** $ 6.16 $ 3.65 $ 2.94
(1) See Note 10 for a discussion of this charge included in the calculation of net income available to common shareholders.
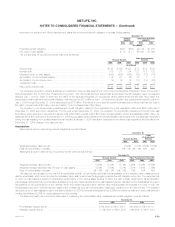
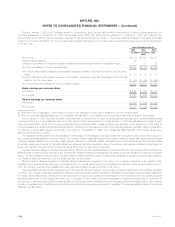
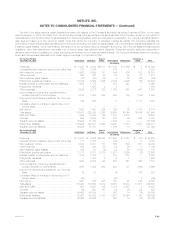
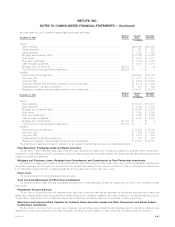
17. Quarterly Results of Operations (Unaudited)
The unaudited quarterly results of operations for 2005 and 2004 are summarized in the table below:
Three Months Ended
March 31, June 30, September 30, December 31,
(In millions, except per share data)
2005
Total revenues ******************************************************************* $10,257 $10,961 $12,012 $11,546
Total expenses ******************************************************************* $ 9,107 $ 9,500 $11,027 $10,743
Income from continuing operations ************************************************** $ 800 $ 1,008 $ 739 $ 592
Income from discontinued operations, net of income taxes ****************************** $ 187 $ 1,237 $ 34 $ 117
Income before cumulative effect of a change in accounting, net of income taxes ************ $ 987 $ 2,245 $ 773 $ 709
Net income available to common shareholders **************************************** $ 987 $ 2,245 $ 773 $ 709
Basic earnings per share:
Income from continuing operations, per common share ******************************* $ 1.09 $ 1.37 $ 0.97 $ 0.78
Income from discontinued operations, net of income taxes, per common share *********** $ 0.25 $ 1.68 $ 0.04 $ 0.15
Income before cumulative effect of a change in accounting, net of income taxes, per
common share *************************************************************** $ 1.34 $ 3.05 $ 1.02 $ 0.93
Net income available to common shareholders, per common share ********************* $ 1.34 $ 3.05 $ 0.98 $ 0.89
Diluted earnings per share:
Income from continuing operations, per common share ******************************* $ 1.08 $ 1.36 $ 0.96 $ 0.77
Income from discontinued operations, net of income taxes, per common share *********** $ 0.25 $ 1.66 $ 0.04 $ 0.15
Income before cumulative effect of a change in accounting, net of income taxes, per
common share *************************************************************** $ 1.33 $ 3.02 $ 1.01 $ 0.92
Net income available to common shareholders, per common share ********************* $ 1.33 $ 3.02 $ 0.97 $ 0.88
MetLife, Inc. F-61