MetLife 2005 Annual Report Download - page 53
Download and view the complete annual report
Please find page 53 of the 2005 MetLife annual report below. You can navigate through the pages in the report by either clicking on the pages listed below, or by using the keyword search tool below to find specific information within the annual report.-
 1
1 -
2
-
3
-
4
-
5
-
6
-
7
-
8
-
9
-
10
-
11
-
12
-
13
-
14
-
15
-
16
-
17
-
18
-
19
-
20
-
21
-
22
-
23
-
24
-
25
-
26
-
27
-
28
-
29
-
30
-
31
-
32
-
33
-
34
-
35
-
36
-
37
-
38
-
39
-
40
-
41
-
42
-
 43
43 -
 44
44 -
 45
45 -
 46
46 -
 47
47 -
 48
48 -
 49
49 -
 50
50 -
 51
51 -
 52
52 -
 53
53 -
 54
54 -
 55
55 -
 56
56 -
 57
57 -
 58
58 -
 59
59 -
 60
60 -
 61
61 -
 62
62 -
 63
63 -
64
-
65
-
66
-
67
-
68
-
69
-
70
-
71
-
72
-
73
-
74
-
75
-
76
-
77
-
78
-
79
-
80
-
81
-
82
-
83
-
84
-
85
-
86
-
87
-
88
-
89
-
90
-
91
-
92
-
93
-
94
-
95
-
96
-
97
-
98
-
99
-
100
-
101
-
102
-
103
-
104
-
105
-
106
-
107
-
108
-
109
-
110
-
111
-
112
-
113
-
114
-
115
-
116
-
117
-
118
-
119
-
120
-
121
-
122
-
123
-
124
-
125
-
126
-
127
-
128
-
129
-
130
-
131
-
132
-
133
 |
 |

as for pools of loans with similar high risk characteristics where a property specific or market risk has not been identified. Loan specific valuation
allowances are established for the excess carrying value of the mortgage loan over the present value of expected future cash flows discounted at the
loan’s original effective interest rate, the value of the loan’s collateral or the loan’s market value if the loan is being sold. Valuation allowances for pools of
loans are established based on property types and loan to value risk factors. The Company records valuation allowances as investment losses. The
Company records subsequent adjustments to allowances as investment gains (losses).
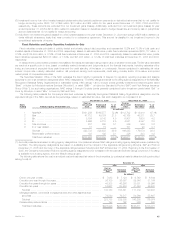
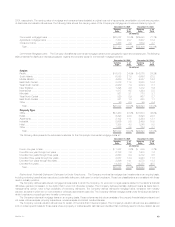
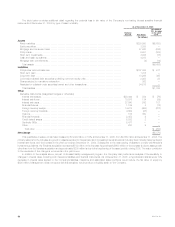
The following table presents the amortized cost and valuation allowance for commercial mortgage loans distributed by loan classification at:
December 31, 2005 December 31, 2004
% of % of
Amortized % of Valuation Amortized Amortized % of Valuation Amortized
Cost(1) Total Allowance Cost Cost(1) Total Allowance Cost
(In millions)
Performing ************************** $28,158 100% $147 0.5% $25,077 99.8% $128 0.5%
Restructured ************************ — — — —% 55 0.2 18 32.7%
Potentially delinquent ***************** 3 — — —% 7 — 3 42.9%
Delinquent or under foreclosure ******** 8— — —% —— — —%
Total ***************************** $28,169 100.0% $147 0.5% $25,139 100.0% $149 0.6%
(1) Amortized cost is equal to carrying value before valuation allowances.
The following table presents the changes in valuation allowances for commercial mortgage loans for the:
Years Ended December 31,
2005 2004 2003
(In millions)
Balance, beginning of year************************************************************************ $149 $122 $119
Additions ************************************************************************************** 43 53 51
Deductions************************************************************************************* (45) (26) (48)
Balance, end of year***************************************************************************** $147 $149 $122
Agricultural Mortgage Loans. The Company diversifies its agricultural mortgage loans by both geographic region and product type.
Approximately 67% of the $7,700 million of agricultural mortgage loans outstanding at December 31, 2005 were subject to rate resets prior to
maturity. A substantial portion of these loans is successfully renegotiated and remains outstanding to maturity. The process and policies for monitoring
the agricultural mortgage loans and classifying them by performance status are generally the same as those for the commercial loans.
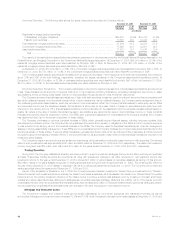
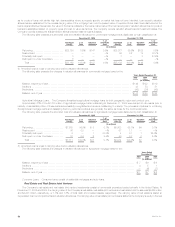
The following table presents the amortized cost and valuation allowances for agricultural mortgage loans distributed by loan classification at:
December 31, 2005 December 31, 2004
% of % of
Amortized % of Valuation Amortized Amortized % of Valuation Amortized
Cost(1) Total Allowance Cost Cost (1) Total Allowance Cost
(In millions)
Performing ************************** $7,635 99.0% $ 8 0.1% $5,803 98.1% $4 0.1%
Restructured ************************ 36 0.5 — —% 67 1.1 — —%
Potentially delinquent ***************** 3 — 1 33.3% 4 0.1 1 25.0%
Delinquent or under foreclosure ******** 37 0.5 2 5.4% 40 0.7 2 5.0%
Total ***************************** $7,711 100.0% $11 0.1% $5,914 100.0% $7 0.1%
(1) Amortized cost is equal to carrying value before valuation allowances.
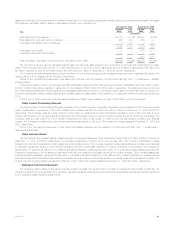
The following table presents the changes in valuation allowances for agricultural mortgage loans for the:
Years Ended
December 31,
2005 2004 2003
(In millions)
Balance, beginning of year *************************************************************************** $ 7 $6 $6
Additions ****************************************************************************************** 45 1
Deductions **************************************************************************************** — (4) (1)
Balance, end of year ******************************************************************************** $11 $ 7 $ 6
Consumer Loans. Consumer loans consist of residential mortgages and auto loans.
Real Estate and Real Estate Joint Ventures
The Company’s real estate and real estate joint venture investments consist of commercial properties located primarily in the United States. At
December 31, 2005 and 2004, the carrying value of the Company’s real estate, real estate joint ventures and real estate held-for-sale was $4,665 million
and $4,233 million, respectively, or 1.5% and 1.8%, of total cash and invested assets, respectively. The carrying value of real estate is stated at
depreciated cost net of impairments and valuation allowances. The carrying value of real estate joint ventures is stated at the Company’s equity in the real
MetLife, Inc.
50