MetLife 2005 Annual Report Download - page 90
Download and view the complete annual report
Please find page 90 of the 2005 MetLife annual report below. You can navigate through the pages in the report by either clicking on the pages listed below, or by using the keyword search tool below to find specific information within the annual report.-
 1
1 -
2
-
3
-
4
-
5
-
6
-
7
-
8
-
9
-
10
-
11
-
12
-
13
-
14
-
15
-
16
-
17
-
18
-
19
-
20
-
21
-
22
-
23
-
24
-
25
-
26
-
27
-
28
-
29
-
30
-
31
-
32
-
33
-
34
-
35
-
36
-
37
-
38
-
39
-
40
-
41
-
42
-
43
-
44
-
45
-
46
-
47
-
48
-
49
-
50
-
51
-
52
-
53
-
54
-
55
-
56
-
57
-
58
-
59
-
60
-
61
-
62
-
63
-
64
-
65
-
66
-
67
-
68
-
69
-
70
-
71
-
72
-
73
-
74
-
75
-
76
-
77
-
78
-
79
-
 80
80 -
 81
81 -
 82
82 -
 83
83 -
 84
84 -
 85
85 -
 86
86 -
 87
87 -
 88
88 -
 89
89 -
 90
90 -
 91
91 -
 92
92 -
 93
93 -
 94
94 -
 95
95 -
 96
96 -
 97
97 -
 98
98 -
 99
99 -
 100
100 -
101
-
102
-
103
-
104
-
105
-
106
-
107
-
108
-
109
-
110
-
111
-
112
-
113
-
114
-
115
-
116
-
117
-
118
-
119
-
120
-
121
-
122
-
123
-
124
-
125
-
126
-
127
-
128
-
129
-
130
-
131
-
132
-
133
 |
 |

METLIFE, INC.
NOTES TO CONSOLIDATED FINANCIAL STATEMENTS — (Continued)
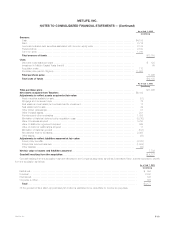
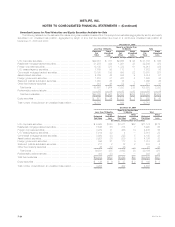
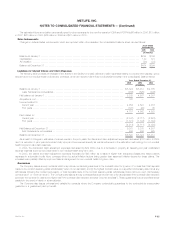
Net Investment Income
The components of net investment income were as follows:
Years Ended December 31,
2005 2004 2003
(In millions)
Fixed maturities *************************************************************************** $11,414 $ 9,397 $ 8,789
Equity securities ************************************************************************** 65 80 31
Mortgage and consumer loans ************************************************************** 2,302 1,963 1,903
Real estate and real estate joint ventures ***************************************************** 804 680 606
Policy loans ****************************************************************************** 572 541 554
Other limited partnership interests************************************************************ 709 324 80
Cash, cash equivalents and short-term investments ******************************************** 400 167 171
Other *********************************************************************************** 472 219 224
Total ********************************************************************************** 16,738 13,371 12,358
Less: Investment expenses ***************************************************************** 1,828 1,007 886
Net investment income ****************************************************************** $14,910 $12,364 $11,472
Net Investment Gains (Losses)
Net investment gains (losses) were as follows:
Years Ended December 31,
2005 2004 2003
(In millions)
Fixed maturities********************************************************************************** $(868) $ 71 $(398)
Equity securities ********************************************************************************* 117 155 41
Mortgage and consumer loans ********************************************************************* 17 (47) (56)
Real estate and real estate joint ventures ************************************************************ 14 16 19
Other limited partnership interests ****************************************************************** 42 53 (84)
Sales of businesses****************************************************************************** 823—
Derivatives ************************************************************************************** 381 (255) (103)
Other ****************************************************************************************** 196 159 30
Net investment gains (losses) ******************************************************************** $ (93) $ 175 $(551)
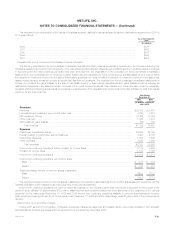
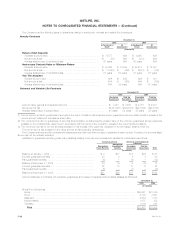
Net Unrealized Investment Gains (Losses)
The components of net unrealized investment gains (losses), included in accumulated other comprehensive income, were as follows:
Years Ended December 31,
2005 2004 2003
(In millions)
Fixed maturities***************************************************************************** $ 6,132 $ 9,602 $ 9,204
Equity securities **************************************************************************** 247 287 376
Derivatives ********************************************************************************* (142) (503) (427)
Minority interest***************************************************************************** (171) (104) (51)
Other ************************************************************************************* (102) 39 18
Total ************************************************************************************ 5,964 9,321 9,120
Amounts allocated from:
Future policy benefit loss recognition ********************************************************* (1,410) (1,991) (1,482)
DAC and VOBA ************************************************************************** (79) (541) (674)
Participating contracts ********************************************************************* — — (183)
Policyholder dividend obligation *************************************************************** (1,492) (2,119) (2,130)
Total ************************************************************************************ (2,981) (4,651) (4,469)
Deferred income taxes*********************************************************************** (1,041) (1,676) (1,679)
Total ************************************************************************************ (4,022) (6,327) (6,148)
Net unrealized investment gains (losses) **************************************************** $ 1,942 $ 2,994 $ 2,972
MetLife, Inc.
F-28