MetLife 2005 Annual Report Download - page 116
Download and view the complete annual report
Please find page 116 of the 2005 MetLife annual report below. You can navigate through the pages in the report by either clicking on the pages listed below, or by using the keyword search tool below to find specific information within the annual report.-
 1
1 -
2
-
3
-
4
-
5
-
6
-
7
-
8
-
9
-
10
-
11
-
12
-
13
-
14
-
15
-
16
-
17
-
18
-
19
-
20
-
21
-
22
-
23
-
24
-
25
-
26
-
27
-
28
-
29
-
30
-
31
-
32
-
33
-
34
-
35
-
36
-
37
-
38
-
39
-
40
-
41
-
42
-
43
-
44
-
45
-
46
-
47
-
48
-
49
-
50
-
51
-
52
-
53
-
54
-
55
-
56
-
57
-
58
-
59
-
60
-
61
-
62
-
63
-
64
-
65
-
66
-
67
-
68
-
69
-
70
-
71
-
72
-
73
-
74
-
75
-
76
-
77
-
78
-
79
-
80
-
81
-
82
-
83
-
84
-
85
-
86
-
87
-
88
-
89
-
90
-
91
-
92
-
93
-
94
-
95
-
96
-
97
-
98
-
99
-
100
-
101
-
102
-
103
-
104
-
105
-
 106
106 -
 107
107 -
 108
108 -
 109
109 -
 110
110 -
 111
111 -
 112
112 -
 113
113 -
 114
114 -
 115
115 -
 116
116 -
 117
117 -
 118
118 -
 119
119 -
 120
120 -
 121
121 -
 122
122 -
 123
123 -
 124
124 -
 125
125 -
 126
126 -
127
-
128
-
129
-
130
-
131
-
132
-
133
 |
 |

METLIFE, INC.
NOTES TO CONSOLIDATED FINANCIAL STATEMENTS — (Continued)
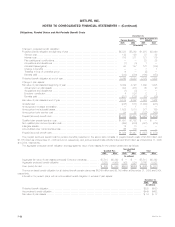
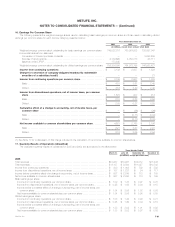
Assumed health care cost trend rates may have a significant effect on the amounts reported for health care plans. A one-percentage point change in
assumed health care cost trend rates would have the following effects:
One Percent One Percent
Increase Decrease
(In millions)
Effect on total of service and interest cost components ************************************************ $ 15 $ (12)
Effect of accumulated postretirement benefit obligation************************************************* $182 $(153)
Plan Assets
The weighted average allocation of pension plan and other postretirement benefit plan assets is as follows:
December 31,
Other
Pension Postretirement
Benefits Benefits
2005 2004 2005 2004
Asset Category
Equity securities******************************************************************************** 47% 50% 42% 41%
Fixed maturities ******************************************************************************** 37% 36% 53% 57%
Other (Real Estate and Alternative Investments)****************************************************** 16% 14% 5% 2%
Total *************************************************************************************** 100% 100% 100% 100%
The weighted average target allocation of pension plan and other postretirement benefit plan assets for 2006 is as follows:
Other
Pension Postretirement
Benefits Benefits
Asset Category
Equity securities ******************************************************************************* 30% - 65% 30% - 45%
Fixed maturities******************************************************************************** 20% - 70% 45% - 70%
Other (Real Estate and Alternative Investments) ***************************************************** 0% - 25% 0% - 10%
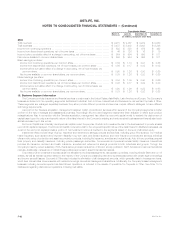
Target allocations of assets are determined with the objective of maximizing returns and minimizing volatility of net assets through adequate asset
diversification. Adjustments are made to target allocations based on an assessment of the impact of economic factors and market conditions.
The account values of the group annuity and life insurance contracts issued by the Subsidiaries and held as assets of the pension and
postretirement benefit plans, were $6,471 million and $6,335 million as of December 31, 2005 and 2004, respectively. The majority of such account
values are held in separate accounts established by the Subsidiaries. Total revenue from these contracts recognized in the consolidated statements of
income was $28 million, $28 million and $90 million for the years ended December 31, 2005, 2004 and 2003, respectively, and includes policy charges,
net investment income from investments backing the contracts and administrative fees. Total investment income, including realized and unrealized gains
and losses, credited to the account balances were $460 million, $519 million and $776 million for the years ended December 31, 2005, 2004 and
2003, respectively. The terms of these contracts are consistent in all material respects with what the Subsidiaries offer to unaffiliated parties which are
similarly situated.
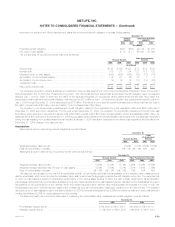
Cash Flows
The Subsidiaries expect to contribute $187 million to its pension plans and $128 million to its other postretirement benefit plans during 2006.
Gross benefit payments for the next ten years, which reflect expected future service as appropriate, are expected to be as follows:
Other
Pension Postretirement
Benefits Benefits
(In millions)
2006 ******************************************************************************************* $ 320 $128
2007 ******************************************************************************************* $ 325 $133
2008 ******************************************************************************************* $ 337 $138
2009 ******************************************************************************************* $ 351 $144
2010 ******************************************************************************************* $ 355 $150
2011-2015 ************************************************************************************** $1,984 $833
Gross subsidy payments expected to be received for the next ten years under the Medicare Prescription Drug, Improvement and Modernization Act
of 2003 are as follows:
Other
Postretirement
Benefits
(In millions)
2006 *************************************************************************************************** $11
2007 *************************************************************************************************** $12
2008 *************************************************************************************************** $13
2009 *************************************************************************************************** $13
2010 *************************************************************************************************** $14
2011-2015 ********************************************************************************************** $83
MetLife, Inc.
F-54