MetLife 2005 Annual Report Download - page 83
Download and view the complete annual report
Please find page 83 of the 2005 MetLife annual report below. You can navigate through the pages in the report by either clicking on the pages listed below, or by using the keyword search tool below to find specific information within the annual report.-
 1
1 -
2
-
3
-
4
-
5
-
6
-
7
-
8
-
9
-
10
-
11
-
12
-
13
-
14
-
15
-
16
-
17
-
18
-
19
-
20
-
21
-
22
-
23
-
24
-
25
-
26
-
27
-
28
-
29
-
30
-
31
-
32
-
33
-
34
-
35
-
36
-
37
-
38
-
39
-
40
-
41
-
42
-
43
-
44
-
45
-
46
-
47
-
48
-
49
-
50
-
51
-
52
-
53
-
54
-
55
-
56
-
57
-
58
-
59
-
60
-
61
-
62
-
63
-
64
-
65
-
66
-
67
-
68
-
69
-
70
-
71
-
72
-
 73
73 -
 74
74 -
 75
75 -
 76
76 -
 77
77 -
 78
78 -
 79
79 -
 80
80 -
 81
81 -
 82
82 -
 83
83 -
 84
84 -
 85
85 -
 86
86 -
 87
87 -
 88
88 -
 89
89 -
 90
90 -
 91
91 -
 92
92 -
 93
93 -
94
-
95
-
96
-
97
-
98
-
99
-
100
-
101
-
102
-
103
-
104
-
105
-
106
-
107
-
108
-
109
-
110
-
111
-
112
-
113
-
114
-
115
-
116
-
117
-
118
-
119
-
120
-
121
-
122
-
123
-
124
-
125
-
126
-
127
-
128
-
129
-
130
-
131
-
132
-
133
 |
 |

METLIFE, INC.
NOTES TO CONSOLIDATED FINANCIAL STATEMENTS — (Continued)
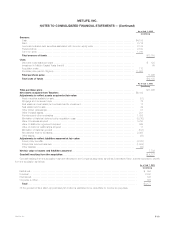
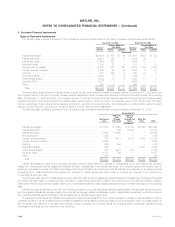
The estimated future amortization of the values of business acquired, distribution agreements and customer relationships acquired from 2006 to
2010 is as follows:
As of December 31,
2005
(In millions)
2006************************************************************************************************ $376
2007************************************************************************************************ $363
2008************************************************************************************************ $347
2009************************************************************************************************ $330
2010************************************************************************************************ $307
Unaudited Pro Forma Condensed Consolidated Financial Information
The following unaudited pro forma condensed consolidated financial information presents the results of operations for the Company assuming the
Travelers acquisition had occurred at the beginning of the respective periods presented. Discontinued operations and the cumulative effects of changes
in accounting and the related earnings per share have been excluded from the presentation of the unaudited pro forma condensed consolidated
statements of income as these are non-recurring in nature. Additionally, the unaudited pro forma condensed consolidated statements of income reflect
the reduction in investment income from the sale of fixed maturity securities, but does not reflect a reduction of investment income from the sale of real
estate property as such investment income is reported as discontinued operations. The unaudited pro forma condensed consolidated statements of
income do not reflect the gains (losses) on the sale of real estate property or fixed maturity securities as such gains (losses) would be reported as
discontinued operations or are sales that would not be part of the normal course of business. This unaudited pro forma information does not necessarily
represent what the Company’s actual results of operations would have been if the acquisition had occurred as of the date indicated or what such results
would be for any future periods.
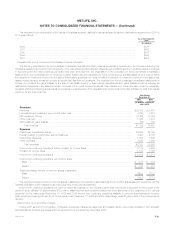
Year Ended
December 31,
2005 2004
(In millions, except per
share data)
Revenues
Premiums ****************************************************************************************** $25,339 $23,514
Universal life and investment-type product policy fees ***************************************************** 4,255 3,612
Net investment income******************************************************************************* 16,405 14,864
Other revenues ************************************************************************************* 1,435 1,276
Net investment gains (losses) ************************************************************************* (52) 189
Total revenues ********************************************************************************** 47,382 43,455
Expenses
Policyholder benefits and claims *********************************************************************** 26,099 24,155
Interest credited to policyholder account balances ******************************************************** 4,495 4,156
Policyholder dividends ******************************************************************************* 1,679 1,666
Other expenses************************************************************************************* 9,920 8,953
Total expenses ********************************************************************************* 42,193 38,930
Income from continuing operations before provision for income taxes **************************************** 5,189 4,525
Provision for income taxes **************************************************************************** 1,510 1,308
Income from continuing operations ********************************************************************* $ 3,679 $ 3,217
Income from continuing operations per common share
Basic ******************************************************************************************* $ 4.84 $ 4.16
Diluted ****************************************************************************************** $ 4.80 $ 4.14
Weighted average number of common shares outstanding
Basic ******************************************************************************************* 760.2 773.3
Diluted ****************************************************************************************** 766.5 777.4
The weighted average number of common shares outstanding in the preceding table assumes the 22.4 million shares issued in connection with the
Travelers acquisition were outstanding as of the beginning of the periods presented.
Income from continuing operations per common share as presented in the preceding table does not include a deduction for the impact of the
preferred stock dividend of approximately $123 million, assuming that such preferred shares had been issued as of the beginning of the periods
presented, for the years ended December 31, 2005 and 2004. Income from continuing operations available to common shareholders per common
share would have been $4.68 and $4.00 for the years ended December 31, 2005 and 2004, respectively, deducting the impact of the preferred stock
dividend.
Restructuring Costs and Other Charges
During 2005, as part of the integration of Travelers’ operations, management approved and initiated plans to reduce approximately 1,000 domestic
and international Travelers employees which is expected to be completed by December 2006.
MetLife, Inc. F-21