MetLife 2005 Annual Report Download - page 21
Download and view the complete annual report
Please find page 21 of the 2005 MetLife annual report below. You can navigate through the pages in the report by either clicking on the pages listed below, or by using the keyword search tool below to find specific information within the annual report.-
 1
1 -
2
-
3
-
4
-
5
-
6
-
7
-
8
-
9
-
10
-
 11
11 -
 12
12 -
 13
13 -
 14
14 -
 15
15 -
 16
16 -
 17
17 -
 18
18 -
 19
19 -
 20
20 -
 21
21 -
 22
22 -
 23
23 -
 24
24 -
 25
25 -
 26
26 -
 27
27 -
 28
28 -
 29
29 -
 30
30 -
 31
31 -
32
-
33
-
34
-
35
-
36
-
37
-
38
-
39
-
40
-
41
-
42
-
43
-
44
-
45
-
46
-
47
-
48
-
49
-
50
-
51
-
52
-
53
-
54
-
55
-
56
-
57
-
58
-
59
-
60
-
61
-
62
-
63
-
64
-
65
-
66
-
67
-
68
-
69
-
70
-
71
-
72
-
73
-
74
-
75
-
76
-
77
-
78
-
79
-
80
-
81
-
82
-
83
-
84
-
85
-
86
-
87
-
88
-
89
-
90
-
91
-
92
-
93
-
94
-
95
-
96
-
97
-
98
-
99
-
100
-
101
-
102
-
103
-
104
-
105
-
106
-
107
-
108
-
109
-
110
-
111
-
112
-
113
-
114
-
115
-
116
-
117
-
118
-
119
-
120
-
121
-
122
-
123
-
124
-
125
-
126
-
127
-
128
-
129
-
130
-
131
-
132
-
133
 |
 |

policyholder dividends of $43 million, net of income taxes, in 2004 contributed to the increase in income from continuing operations. These increases in
income from continuing operations are partially offset by a reduction in earnings of $101 million, net of income taxes, resulting from an increase in the
closed block-related policyholder dividend obligation, associated primarily with an improvement in net investment gains (losses). Higher DAC amortization
of $72 million, net of income taxes, also increased expenses for the year ended December 31, 2004. Additionally, offsetting these increases are lower
net investment income on traditional life and income annuity products of $32 million, net of income taxes. The application of SOP 03-1 and the
corresponding cost of hedging guaranteed annuity benefit riders reduced earnings by $30 million, net of income taxes. In addition, less favorable
underwriting results in the traditional and universal life products of $22 million, net of income taxes, and higher general spending of $17 million, net of
income taxes, added to this offset. These underwriting results are significantly influenced by mortality experience and the reinsurance activity related to
certain blocks of business and, as a result, can fluctuate from period to period.
Total revenues, excluding net investment gains (losses), increased by $86 million, or 1%, to $12,462 million for the year ended December 31, 2004
from $12,376 million for the comparable 2003 period. This increase includes higher fee income primarily from separate account products of $256 million
resulting from a combination of growth in the business and improved overall market performance. Policy fees from variable life and annuity and
investment-type products are typically calculated as a percentage of the average assets in policyholder accounts. The value of these assets can fluctuate
depending on equity performance. In addition, management attributes higher premiums of $37 million in 2004 to the active marketing of income annuity
products. The increased volume of sales in 2004 also resulted in higher broker/dealer and other subsidiaries revenues of $27 million. Partially offsetting
the increases in total revenues for the year ended December 31, 2004 are lower premiums of $196 million which are primarily related to the Company’s
closed block of business which decreased by $209 million and continues to run off at management’s expected range of 3% to 6% per year. In addition,
lower net investment income of $38 million resulting from lower investment yields offset increases in total revenues.
Total expenses decreased by $25 million, or less than 1%, to $11,261 million for the year ended December 31, 2004 from $11,286 million for the
comparable 2003 period. Lower expenses are primarily the result of a $193 million decrease in the closed block policyholder benefits, commensurate
with the net decrease in premiums and a $116 million decline in interest credited to policyholder account balances due to lower crediting rates. Also
included in the decrease in expenses are lower policyholder dividends of $64 million primarily resulting from reductions in the dividend scale in late 2003
and a charge in 2003 related to certain improperly deferred expenses at New England Financial of $48 million. Partially offsetting these decreases in
expenses is a $151 million increase in the closed block-related policyholder dividend obligation based on positive performance of the closed block and
higher DAC amortization of $108 million. The increase in DAC amortization is a result of accelerated amortization resulting from improvement in net
investment gains (losses) and the update of management’s assumptions used to determine estimated gross margins. Additionally, offsetting the
decrease to expenses is a $46 million increase from the application of SOP 03-1 and the corresponding cost of hedging guaranteed annuity benefit
riders, a $35 million increase in future policy benefits commensurate with the increase in income annuity premiums, and a $10 million increase in
policyholder benefits primarily due to higher amortization of deferred sales inducements due to growth in expenses. Further, the decrease in expenses
was offset by higher general spending of $26 million and a $10 million increase in broker/dealer and other subsidiary-related expenses. Additionally,
unfavorable underwriting results in the traditional and universal life products of $9 million contributed to the increase.
Auto & Home
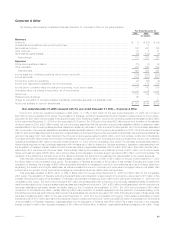
The following table presents consolidated financial information for the Auto & Home segment for the years indicated:
Year Ended December 31,
2005 2004 2003
(In millions)
Revenues
Premiums ********************************************************************************* $2,911 $2,948 $2,908
Net investment income ********************************************************************** 181 171 158
Other revenues **************************************************************************** 33 35 33
Net investment gains (losses) **************************************************************** (12) (9) (15)
Total revenues *************************************************************************** 3,113 3,145 3,084
Expenses
Policyholder benefits and claims ************************************************************** 1,994 2,079 2,139
Policyholder dividends*********************************************************************** 322
Other expenses **************************************************************************** 828 795 756
Total expenses*************************************************************************** 2,825 2,876 2,897
Income before provision for income taxes ****************************************************** 288 269 187
Provision for income taxes ******************************************************************* 64 61 30
Net income ******************************************************************************* $ 224 $ 208 $ 157
Year ended December 31, 2005 compared with the year ended December 31, 2004 — Auto & Home
Net income increased by $16 million, or 8%, to $224 million for the year ended December 31, 2005 from $208 million for the comparable 2004
period. The increase is primarily the result of improvements in the development of prior years claims of $40 million, net of income taxes, and an
improvement in the non-catastrophe combined ratio resulting in $16 million, net of income taxes, primarily due to lower automobile and homeowner claim
frequencies. Also contributing to this increase in net income is an improvement in losses from the involuntary Massachusetts automobile plan of
$12 million, net of income taxes, an increase in net investment income of $6 million, net of income taxes, and an increase in earned premium of
$4 million, net of income taxes, as discussed below. Offsetting these improved results, is an increase in catastrophes, including Hurricanes Katrina and
Wilma of $63 million, net of income taxes.
Total revenues, excluding net investment gains (losses), decreased by $29 million, or 1%, to $3,125 million for the year ended December 31, 2005
from $3,154 million for the comparable 2004 period. This decrease is primarily attributable to reinstatement and additional reinsurance-related premiums
due to Hurricane Katrina of $43 million. This decrease was partially offset by higher net investment income of $10 million, primarily due to a change in the
MetLife, Inc.
18