MetLife 2005 Annual Report Download - page 85
Download and view the complete annual report
Please find page 85 of the 2005 MetLife annual report below. You can navigate through the pages in the report by either clicking on the pages listed below, or by using the keyword search tool below to find specific information within the annual report.-
 1
1 -
2
-
3
-
4
-
5
-
6
-
7
-
8
-
9
-
10
-
11
-
12
-
13
-
14
-
15
-
16
-
17
-
18
-
19
-
20
-
21
-
22
-
23
-
24
-
25
-
26
-
27
-
28
-
29
-
30
-
31
-
32
-
33
-
34
-
35
-
36
-
37
-
38
-
39
-
40
-
41
-
42
-
43
-
44
-
45
-
46
-
47
-
48
-
49
-
50
-
51
-
52
-
53
-
54
-
55
-
56
-
57
-
58
-
59
-
60
-
61
-
62
-
63
-
64
-
65
-
66
-
67
-
68
-
69
-
70
-
71
-
72
-
73
-
74
-
 75
75 -
 76
76 -
 77
77 -
 78
78 -
 79
79 -
 80
80 -
 81
81 -
 82
82 -
 83
83 -
 84
84 -
 85
85 -
 86
86 -
 87
87 -
 88
88 -
 89
89 -
 90
90 -
 91
91 -
 92
92 -
 93
93 -
 94
94 -
 95
95 -
96
-
97
-
98
-
99
-
100
-
101
-
102
-
103
-
104
-
105
-
106
-
107
-
108
-
109
-
110
-
111
-
112
-
113
-
114
-
115
-
116
-
117
-
118
-
119
-
120
-
121
-
122
-
123
-
124
-
125
-
126
-
127
-
128
-
129
-
130
-
131
-
132
-
133
 |
 |

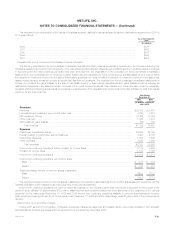
METLIFE, INC.
NOTES TO CONSOLIDATED FINANCIAL STATEMENTS — (Continued)
December 31, 2004
Cost or Gross Unrealized
Amortized Estimated % of
Cost Gain Loss Fair Value Total
(In millions)
U.S. corporate securities ************************************************* $ 58,022 $ 3,870 $172 $ 61,720 34.9%
Residential mortgage-backed securities ************************************* 31,683 612 65 32,230 18.3
Foreign corporate securities *********************************************** 24,972 2,582 85 27,469 15.6
U.S. treasury/agency securities ******************************************** 16,534 1,314 22 17,826 10.1
Commercial mortgage-backed securities ************************************ 12,099 440 38 12,501 7.1
Asset-backed securities ************************************************** 10,784 125 33 10,876 6.2
Foreign government securities ********************************************* 7,621 973 26 8,568 4.8
State and political subdivision securities ************************************* 3,683 220 4 3,899 2.2
Other fixed maturity securities ********************************************* 887 131 33 985 0.6
Total bonds ********************************************************** 166,285 10,267 478 176,074 99.8
Redeemable preferred stocks ********************************************* 326 — 23 303 0.2
Total fixed maturities *************************************************** $166,611 $10,267 $501 $176,377 100.0%
Common stocks ******************************************************** $ 1,412 $ 244 $ 5 $ 1,651 75.5%
Non-redeemable preferred stocks ****************************************** 501 39 3 537 24.5
Total equity securities ************************************************** $ 1,913 $ 283 $ 8 $ 2,188 100.0%
The Company held foreign currency derivatives with notional amounts of $5,695 million and $4,720 million to hedge the exchange rate risk
associated with foreign bonds and loans at December 31, 2005 and 2004, respectively.
Excluding investments in U.S. Treasury securities and obligations of U.S. government corporations and agencies, the Company is not exposed to
any significant concentration of credit risk in its fixed maturities portfolio.
The Company held fixed maturities at estimated fair values that were below investment grade or not rated by an independent rating agency that
totaled $15,157 million and $12,353 million at December 31, 2005 and 2004, respectively. These securities had a net unrealized gain of $392 million
and $935 million at December 31, 2005 and 2004, respectively. Non-income producing fixed maturities were $15 million and $90 million at
December 31, 2005 and 2004, respectively. Unrealized losses associated with non-income producing fixed maturities were $3 million and $11 million at
December 31, 2005 and 2004, respectively.
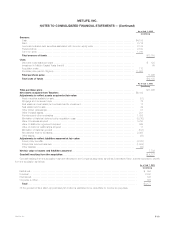
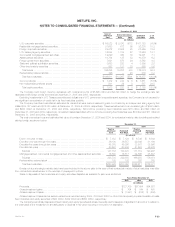
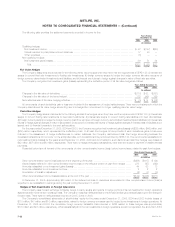
The cost or amortized cost and estimated fair value of bonds at December 31, 2005 and 2004, by contractual maturity date (excluding scheduled
sinking funds), are shown below:
December 31,
2005 2004
Cost or Cost or
Amortized Estimated Amortized Estimated
Cost Fair Value Cost Fair Value
(In millions)
Due in one year or less ***************************************************** $ 7,083 $ 7,124 $ 6,749 $ 6,844
Due after one year through five years ****************************************** 36,100 36,557 29,846 31,164
Due after five years through ten years ***************************************** 45,303 46,256 33,531 35,996
Due after ten years ********************************************************* 58,667 63,404 41,593 46,463
Subtotal **************************************************************** 147,153 153,341 111,719 120,467
Mortgage-backed, commercial mortgage-backed and other asset-backed securities ** 76,580 76,517 54,566 55,607
Subtotal **************************************************************** 223,733 229,858 166,285 176,074
Redeemable preferred stock ************************************************* 193 192 326 303
Total fixed maturities ****************************************************** $223,926 $230,050 $166,611 $176,377
Bonds not due at a single maturity date have been included in the above table in the year of final contractual maturity. Actual maturities may differ
from contractual maturities due to the exercise of prepayment options.
Sales or disposals of fixed maturities and equity securities classified as available-for-sale were as follows:
Years Ended December 31,
2005 2004 2003
(In millions)
Proceeds******************************************************************************* $127,709 $57,604 $54,801
Gross investment gains ******************************************************************* $ 704 $ 844 $ 498
Gross investment losses ****************************************************************** $ (1,391) $ (516) $ (500)
Gross investment losses above exclude writedowns recorded during 2005, 2004 and 2003 for other-than-temporarily impaired available-for-sale
fixed maturities and equity securities of $64 million, $102 million and $355 million, respectively.
The Company periodically disposes of fixed maturity and equity securities at a loss. Generally, such losses are insignificant in amount or in relation to
the cost basis of the investment or are attributable to declines in fair value occurring in the period of disposition.
MetLife, Inc. F-23