MetLife 2005 Annual Report Download - page 89
Download and view the complete annual report
Please find page 89 of the 2005 MetLife annual report below. You can navigate through the pages in the report by either clicking on the pages listed below, or by using the keyword search tool below to find specific information within the annual report.-
 1
1 -
2
-
3
-
4
-
5
-
6
-
7
-
8
-
9
-
10
-
11
-
12
-
13
-
14
-
15
-
16
-
17
-
18
-
19
-
20
-
21
-
22
-
23
-
24
-
25
-
26
-
27
-
28
-
29
-
30
-
31
-
32
-
33
-
34
-
35
-
36
-
37
-
38
-
39
-
40
-
41
-
42
-
43
-
44
-
45
-
46
-
47
-
48
-
49
-
50
-
51
-
52
-
53
-
54
-
55
-
56
-
57
-
58
-
59
-
60
-
61
-
62
-
63
-
64
-
65
-
66
-
67
-
68
-
69
-
70
-
71
-
72
-
73
-
74
-
75
-
76
-
77
-
78
-
 79
79 -
 80
80 -
 81
81 -
 82
82 -
 83
83 -
 84
84 -
 85
85 -
 86
86 -
 87
87 -
 88
88 -
 89
89 -
 90
90 -
 91
91 -
 92
92 -
 93
93 -
 94
94 -
 95
95 -
 96
96 -
 97
97 -
 98
98 -
 99
99 -
100
-
101
-
102
-
103
-
104
-
105
-
106
-
107
-
108
-
109
-
110
-
111
-
112
-
113
-
114
-
115
-
116
-
117
-
118
-
119
-
120
-
121
-
122
-
123
-
124
-
125
-
126
-
127
-
128
-
129
-
130
-
131
-
132
-
133
 |
 |

METLIFE, INC.
NOTES TO CONSOLIDATED FINANCIAL STATEMENTS — (Continued)
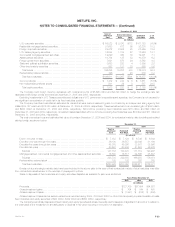
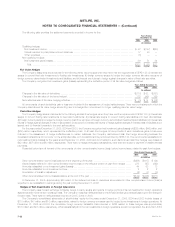
Accumulated depreciation on real estate was $1,326 million and $2,005 million at December 31, 2005 and 2004, respectively. Related
depreciation expense was $136 million, $179 million and $183 million for the years ended December 31, 2005, 2004 and 2003, respectively. These
amounts include $15 million, $76 million and $86 million of depreciation expense related to discontinued operations for the years ended December 31,
2005, 2004 and 2003, respectively.
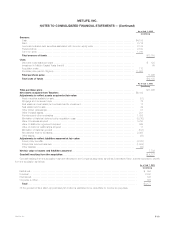
Real estate and real estate joint ventures were categorized as follows:
December 31,
2005 2004
Amount Percent Amount Percent
(In millions)
Office ****************************************************************************** $2,597 56% $2,297 54%
Apartments************************************************************************** 892 19 918 22
Retail******************************************************************************* 614 13 558 13
Other******************************************************************************* 469 10 403 10
Land ******************************************************************************* 60 1 56 1
Agriculture ************************************************************************** 33 1 1 —
Total ***************************************************************************** $4,665 100% $4,233 100%
The Company’s real estate holdings are primarily located in the United States. At December 31, 2005, approximately 23%, 22% and 16% of the
Company’s real estate holdings were located in California, New York and Texas, respectively.
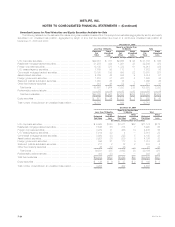
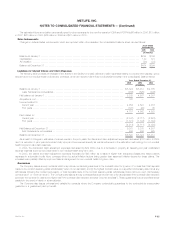
Changes in the real estate and real estate joint ventures held-for-sale valuation allowance were as follows:
Years Ended
December 31,
2005 2004 2003
(In millions)
Balance, beginning of year**************************************************************************** $4 $12 $11
Additions ****************************************************************************************** 51317
Deductions***************************************************************************************** (9) (21) (16)
Balance, end of year ******************************************************************************** $— $ 4 $12
Investment income related to impaired real estate and real estate joint ventures held-for-investment was $7 million, $15 million and $34 million for the
years ended December 31, 2005, 2004 and 2003, respectively. There was no investment income (expense) related to impaired real estate and real
estate joint ventures held-for-sale for the year ended December 31, 2005. Investment income (expense) related to impaired real estate and real estate
joint ventures held-for-sale was ($1) million and $1 million for the years ended December 31, 2004 and 2003, respectively. The carrying value of non-
income producing real estate and real estate joint ventures was $37 million and $41 million at December 31, 2005 and 2004, respectively.
The Company owned real estate acquired in satisfaction of debt of $4 million at December 31, 2005 and 2004.
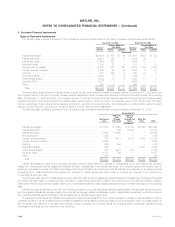
Leveraged Leases
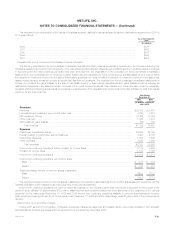
Leveraged leases, included in other invested assets, consisted of the following:
December 31,
2005 2004
(In millions)
Investment ******************************************************************************************* $ 991 $1,059
Estimated residual values ******************************************************************************* 735 480
Total ********************************************************************************************** 1,726 1,539
Unearned income ************************************************************************************* (645) (424)
Leveraged leases *********************************************************************************** $1,081 $1,115
The investment amounts set forth above are generally due in monthly installments. The payment periods generally range from one to 15 years, but in
certain circumstances are as long as 30 years. These receivables are generally collateralized by the related property. The Company’s deferred income
tax liability related to leveraged leases was $605 million and $757 million at December 31, 2005 and 2004, respectively.
Funds Withheld at Interest
Included in other invested assets at December 31, 2005 and 2004, were funds withheld at interest of $3,492 million and $2,801 million,
respectively.
MetLife, Inc. F-27