MetLife 2005 Annual Report Download - page 49
Download and view the complete annual report
Please find page 49 of the 2005 MetLife annual report below. You can navigate through the pages in the report by either clicking on the pages listed below, or by using the keyword search tool below to find specific information within the annual report.-
 1
1 -
2
-
3
-
4
-
5
-
6
-
7
-
8
-
9
-
10
-
11
-
12
-
13
-
14
-
15
-
16
-
17
-
18
-
19
-
20
-
21
-
22
-
23
-
24
-
25
-
26
-
27
-
28
-
29
-
30
-
31
-
32
-
33
-
34
-
35
-
36
-
37
-
38
-
 39
39 -
 40
40 -
 41
41 -
 42
42 -
 43
43 -
 44
44 -
 45
45 -
 46
46 -
 47
47 -
 48
48 -
 49
49 -
 50
50 -
 51
51 -
 52
52 -
 53
53 -
 54
54 -
 55
55 -
 56
56 -
 57
57 -
 58
58 -
 59
59 -
60
-
61
-
62
-
63
-
64
-
65
-
66
-
67
-
68
-
69
-
70
-
71
-
72
-
73
-
74
-
75
-
76
-
77
-
78
-
79
-
80
-
81
-
82
-
83
-
84
-
85
-
86
-
87
-
88
-
89
-
90
-
91
-
92
-
93
-
94
-
95
-
96
-
97
-
98
-
99
-
100
-
101
-
102
-
103
-
104
-
105
-
106
-
107
-
108
-
109
-
110
-
111
-
112
-
113
-
114
-
115
-
116
-
117
-
118
-
119
-
120
-
121
-
122
-
123
-
124
-
125
-
126
-
127
-
128
-
129
-
130
-
131
-
132
-
133
 |
 |

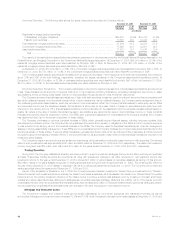
Bonds not due at a single maturity date have been included in the above table in the year of final contractual maturity. Actual maturities may differ
from contractual maturities due to the exercise of prepayment options.
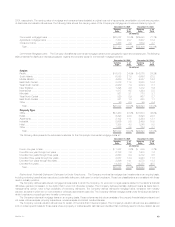
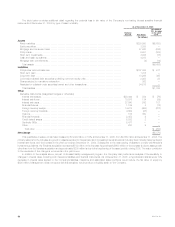
The following tables set forth the cost or amortized cost, gross unrealized gain and loss, and estimated fair value of the Company’s fixed maturities
by sector and equity securities, the percentage of the total fixed maturities holdings that each sector represents and the percentage of the total equity
securities at:
December 31, 2005
Cost or Gross Unrealized
Amortized Estimated % of
Cost Gain Loss Fair Value Total
(In millions)
U.S. corporate securities********************************************* $ 72,339 $2,814 $ 835 $ 74,318 32.3%
Residential mortgage-backed securities********************************* 47,365 353 472 47,246 20.5
Foreign corporate securities ****************************************** 33,578 1,842 439 34,981 15.2
U.S. treasury/agency securities *************************************** 25,643 1,401 86 26,958 11.7
Commercial mortgage-backed securities******************************** 17,682 223 207 17,698 7.7
Asset-backed securities ********************************************* 11,533 91 51 11,573 5.0
Foreign government securities **************************************** 10,080 1,401 35 11,446 5.0
State and political subdivision securities ******************************** 4,601 185 36 4,750 2.1
Other fixed maturity securities ***************************************** 912 17 41 888 0.4
Total bonds ****************************************************** 223,733 8,327 2,202 229,858 99.9
Redeemable preferred stocks***************************************** 193 2 3 192 0.1
Total fixed maturities********************************************* $223,926 $8,329 $2,205 $230,050 100.0%
Common stocks**************************************************** $ 2,004 $ 250 $ 30 $ 2,224 66.6%
Non-redeemable preferred stocks ************************************* 1,080 45 11 1,114 33.4
Total equity securities(1)****************************************** $ 3,084 $ 295 $ 41 $ 3,338 100.0%
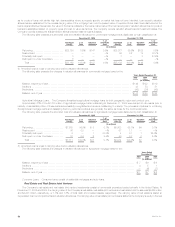
December 31, 2004
Cost or Gross Unrealized
Amortized Estimated % of
Cost Gain Loss Fair Value Total
(In millions)
U.S. corporate securities ********************************************* $ 58,022 $ 3,870 $172 $ 61,720 34.9%
Residential mortgage-backed securities ********************************* 31,683 612 65 32,230 18.3
Foreign corporate securities ******************************************* 24,972 2,582 85 27,469 15.6
U.S. treasury/agency securities **************************************** 16,534 1,314 22 17,826 10.1
Commercial mortgage-backed securities ******************************** 12,099 440 38 12,501 7.1
Asset-backed securities ********************************************** 10,784 125 33 10,876 6.2
Foreign government securities ***************************************** 7,621 973 26 8,568 4.8
State and political subdivision securities ********************************* 3,683 220 4 3,899 2.2
Other fixed maturity securities ***************************************** 887 131 33 985 0.6
Total bonds **************************************************** 166,285 10,267 478 176,074 99.8
Redeemable preferred stocks ***************************************** 326 — 23 303 0.2
Total fixed maturities *********************************************** $166,611 $10,267 $501 $176,377 100.0%
Common stocks **************************************************** $ 1,412 $ 244 $ 5 $ 1,651 75.5%
Non-redeemable preferred stocks ************************************** 501 39 3 537 24.5
Total equity securities(1) ******************************************** $ 1,913 $ 283 $ 8 $ 2,188 100.0%
(1) Equity securities primarily consist of investments in common and preferred stocks and mutual fund interests. Such securities include private equity
securities with an estimated fair value of $472 million and $332 million at December 31, 2005 and 2004, respectively.
Fixed Maturity and Equity Security Impairment. The Company classifies all of its fixed maturities and equity securities as available-for-sale and
marks them to market through other comprehensive income, except for non-marketable private equities, which are generally carried at cost. All securities
with gross unrealized losses at the consolidated balance sheet date are subjected to the Company’s process for identifying other- than-temporary
impairments. The Company writes down to fair value securities that it deems to be other-than-temporarily impaired in the period the securities are
deemed to be so impaired. The assessment of whether such impairment has occurred is based on management’s case-by-case evaluation of the
underlying reasons for the decline in fair value. Management considers a wide range of factors, as described in ‘‘— Summary of Critical Accounting
Estimates — Investments,’’ about the security issuer and uses its best judgment in evaluating the cause of the decline in the estimated fair value of the
security and in assessing the prospects for near-term recovery. Inherent in management’s evaluation of the security are assumptions and estimates
about the operations of the issuer and its future earnings potential.
The Company’s review of its fixed maturities and equity securities for impairments includes an analysis of the total gross unrealized losses by three
categories of securities: (i) securities where the estimated fair value had declined and remained below cost or amortized cost by less than 20%;
(ii) securities where the estimated fair value had declined and remained below cost or amortized cost by 20% or more for less than six months; and
(iii) securities where the estimated fair value had declined and remained below cost or amortized cost by 20% or more for six months or greater. While all
of these securities are monitored for potential impairment, the Company’s experience indicates that the first two categories do not present as great a risk
of impairment, and often, fair values recover over time as the factors that caused the declines improve.
MetLife, Inc.
46