MetLife 2005 Annual Report Download - page 14
Download and view the complete annual report
Please find page 14 of the 2005 MetLife annual report below. You can navigate through the pages in the report by either clicking on the pages listed below, or by using the keyword search tool below to find specific information within the annual report.-
 1
1 -
2
-
3
-
 4
4 -
 5
5 -
 6
6 -
 7
7 -
 8
8 -
 9
9 -
 10
10 -
 11
11 -
 12
12 -
 13
13 -
 14
14 -
 15
15 -
 16
16 -
 17
17 -
 18
18 -
 19
19 -
 20
20 -
 21
21 -
 22
22 -
 23
23 -
 24
24 -
25
-
26
-
27
-
28
-
29
-
30
-
31
-
32
-
33
-
34
-
35
-
36
-
37
-
38
-
39
-
40
-
41
-
42
-
43
-
44
-
45
-
46
-
47
-
48
-
49
-
50
-
51
-
52
-
53
-
54
-
55
-
56
-
57
-
58
-
59
-
60
-
61
-
62
-
63
-
64
-
65
-
66
-
67
-
68
-
69
-
70
-
71
-
72
-
73
-
74
-
75
-
76
-
77
-
78
-
79
-
80
-
81
-
82
-
83
-
84
-
85
-
86
-
87
-
88
-
89
-
90
-
91
-
92
-
93
-
94
-
95
-
96
-
97
-
98
-
99
-
100
-
101
-
102
-
103
-
104
-
105
-
106
-
107
-
108
-
109
-
110
-
111
-
112
-
113
-
114
-
115
-
116
-
117
-
118
-
119
-
120
-
121
-
122
-
123
-
124
-
125
-
126
-
127
-
128
-
129
-
130
-
131
-
132
-
133
 |
 |

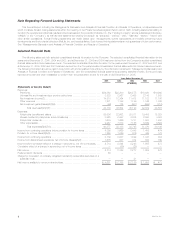
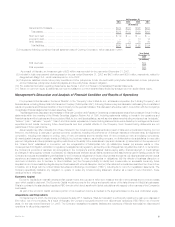
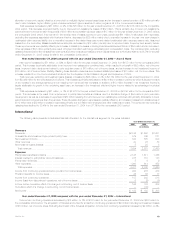
Discussion of Results
Year Ended December 31,
2005 2004 2003
(In millions)
Revenues
Premiums****************************************************************************** $24,860 $22,200 $20,575
Universal life and investment-type product policy fees ***************************************** 3,828 2,867 2,495
Net investment income ****************************************************************** 14,910 12,364 11,472
Other revenues ************************************************************************* 1,271 1,198 1,199
Net investment gains (losses) ************************************************************* (93) 175 (551)
Total revenues************************************************************************ 44,776 38,804 35,190
Expenses
Policyholder benefits and claims *********************************************************** 25,506 22,662 20,811
Interest credited to policyholder account balances ******************************************** 3,925 2,997 3,035
Policyholder dividends ******************************************************************* 1,679 1,666 1,731
Other expenses ************************************************************************ 9,267 7,813 7,168
Total expenses *********************************************************************** 40,377 35,138 32,745
Income from continuing operations before provision for income taxes **************************** 4,399 3,666 2,445
Provision for income taxes**************************************************************** 1,260 1,029 616
Income from continuing operations********************************************************* 3,139 2,637 1,829
Income from discontinued operations, net of income taxes************************************* 1,575 207 414
Income before cumulative effect of a change in accounting, net of income taxes ****************** 4,714 2,844 2,243
Cumulative effect of a change in accounting, net of income taxes ****************************** — (86) (26)
Net income **************************************************************************** 4,714 2,758 2,217
Preferred stock dividends **************************************************************** 63 — —
Charge for conversion of company-obligated mandatorily redeemable securities of a subsidiary trust** ——21
Net income available to common shareholders*********************************************** $ 4,651 $ 2,758 $ 2,196
Year ended December 31, 2005 compared with the year ended December 31, 2004 — The Company
Income from continuing operations increased by $502 million, or 19%, to $3,139 million for the year ended December 31, 2005 from $2,637 million
in the comparable 2004 period. The current period includes $233 million of income from continuing operations related to the acquisition of Travelers.
Included in the Travelers results is a charge for the establishment of an excess mortality reserve related to group of specific policies. In connection with
MetLife’s acquisition of Travelers, the Company has performed reviews of Travelers underwriting criteria in its effort to refine its estimated fair values for the
purchase price allocation. As a result of these reviews and actuarial analyses, and to be consistent with MetLife’s existing reserving methodologies, the
Company has established an excess mortality reserve on a specific group of policies. This resulted in a charge of $20 million, net of income taxes, to
fourth quarter results. The Company expects to complete its reviews and refine its estimate of the excess mortality reserve by June 30, 2006. Excluding
the acquisition of Travelers, income from continuing operations increased by $269 million, or 10%. Income from continuing operations for the year ended
December 31, 2005 and 2004 includes the impact of certain transactions or events, the timing, nature and amount of which are generally unpredictable.
These transactions are described in each applicable segment’s discussion below. These items contributed a benefit of $71 million, net of income taxes,
to the year ended December 31, 2005 and a benefit of $113 million, net of income taxes, to the comparable 2004 period. Excluding the impact of these
items, income from continuing operations increased by $311 million for the year ended December 31, 2005 compared to the prior 2004 period. The
Individual segment contributed $248 million, net of income taxes, to the increase, as a result of interest rate spreads, increased fee income related to the
growth in separate account products, favorable underwriting, a decrease in the closed block-related policyholder dividend obligation, lower annuity net
guaranteed benefit costs and lower DAC amortization. These increases were partially offset by lower net investment income, net investment losses and
higher operating costs offset by revisions to certain expense, premium tax and policyholder liability estimates in the current year and write-offs of certain
assets in the prior year. The Institutional segment contributed $50 million, net of income taxes, to this increase primarily due to favorable interest spreads,
partially offset by a decrease in net investment gains, an adjustment recorded on DAC associated with certain long-term care products in 2005,
unfavorable underwriting and an increase in other expenses. The Auto & Home segment contributed $16 million, net of income taxes, to the 2005
increase primarily due to improvements in the development of prior year claims, the non-catastrophe combined ratio, and losses from the involuntary
Massachusetts automobile plan, as well as an increase in net investment income and earned premium. These increases in the Auto & Home segment
were partially offset by an increase in catastrophes as a result of the impact of Hurricanes Katrina and Wilma and an increase in other expenses. The
Reinsurance segment contributed $9 million, net of income taxes, to this increase primarily due to premium growth and higher net investment income,
partially offset by unfavorable mortality as a result of higher claim levels in the U.S. and U.K. and a reduction in net investment gains. The International
segment contributed $9 million, net of income taxes, primarily due to business growth in South Korea, Chile and Mexico. These increases in the
International segment were partially offset by an increase in certain policyholder liabilities caused by unrealized investment gains (losses) on the invested
assets supporting those liabilities, an increase in expenses for start up costs and contingency liabilities in Mexico, as well as a decrease in Canada
primarily due to a realignment of economic capital offset by the strengthening of the liability on its pension business related to changes in mortality
assumptions in the prior year and higher oversight and infrastructure expenditures in support of the segment growth. These increases in income from
continuing operations were partially offset by a decrease of $21 million, net of income taxes, in Corporate & Other. The decrease in Corporate & Other is
primarily due to higher interest expense on debt, integration costs associated with the acquisition of Travelers, higher interest credited on bank holder
deposits and legal-related liabilities, partially offset by an increase in net investment income, higher net investment gains and a decrease in corporate
support expenses.
MetLife, Inc. 11