MetLife 2005 Annual Report Download - page 88
Download and view the complete annual report
Please find page 88 of the 2005 MetLife annual report below. You can navigate through the pages in the report by either clicking on the pages listed below, or by using the keyword search tool below to find specific information within the annual report.-
 1
1 -
2
-
3
-
4
-
5
-
6
-
7
-
8
-
9
-
10
-
11
-
12
-
13
-
14
-
15
-
16
-
17
-
18
-
19
-
20
-
21
-
22
-
23
-
24
-
25
-
26
-
27
-
28
-
29
-
30
-
31
-
32
-
33
-
34
-
35
-
36
-
37
-
38
-
39
-
40
-
41
-
42
-
43
-
44
-
45
-
46
-
47
-
48
-
49
-
50
-
51
-
52
-
53
-
54
-
55
-
56
-
57
-
58
-
59
-
60
-
61
-
62
-
63
-
64
-
65
-
66
-
67
-
68
-
69
-
70
-
71
-
72
-
73
-
74
-
75
-
76
-
77
-
 78
78 -
 79
79 -
 80
80 -
 81
81 -
 82
82 -
 83
83 -
 84
84 -
 85
85 -
 86
86 -
 87
87 -
 88
88 -
 89
89 -
 90
90 -
 91
91 -
 92
92 -
 93
93 -
 94
94 -
 95
95 -
 96
96 -
 97
97 -
 98
98 -
99
-
100
-
101
-
102
-
103
-
104
-
105
-
106
-
107
-
108
-
109
-
110
-
111
-
112
-
113
-
114
-
115
-
116
-
117
-
118
-
119
-
120
-
121
-
122
-
123
-
124
-
125
-
126
-
127
-
128
-
129
-
130
-
131
-
132
-
133
 |
 |

METLIFE, INC.
NOTES TO CONSOLIDATED FINANCIAL STATEMENTS — (Continued)
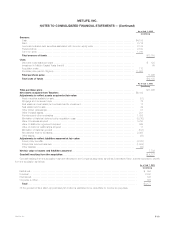
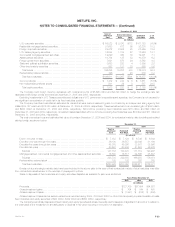
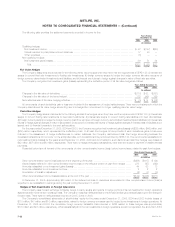
Mortgage and Consumer Loans
Mortgage and consumer loans were categorized as follows:
December 31,
2005 2004
Amount Percent Amount Percent
(In millions)
Commercial mortgage loans ********************************************************* $28,169 75% $25,139 77%
Agricultural mortgage loans ********************************************************** 7,711 21 5,914 18
Consumer loans ******************************************************************* 1,482 4 1,510 5
Total *************************************************************************** 37,362 100% 32,563 100%
Less: Valuation allowances ********************************************************** 172 157
Mortgage and consumer loans ******************************************************* $37,190 $32,406
Mortgage loans are collateralized by properties primarily located in the United States. At December 31, 2005, approximately 22%, 9% and 7% of the
properties were located in California, New York and Illinois, respectively. Generally, the Company (as the lender) requires that a minimum of one-fourth of
the purchase price of the underlying real estate be paid by the borrower.
Certain of the Company’s real estate joint ventures have mortgage loans with the Company. The carrying values of such mortgages were
$379 million and $641 million at December 31, 2005 and 2004, respectively.
Changes in loan valuation allowances for mortgage and consumer loans were as follows:
Years Ended
December 31,
2005 2004 2003
(In millions)
Balance, beginning of year************************************************************************** $157 $129 $126
Additions **************************************************************************************** 64 57 52
Deductions*************************************************************************************** (49) (29) (49)
Balance, end of year******************************************************************************* $172 $157 $129
A portion of the Company’s mortgage and consumer loans was impaired and consisted of the following:
December 31,
2005 2004
(In millions)
Impaired loans with valuation allowances********************************************************************** $ 22 $185
Impaired loans without valuation allowances ******************************************************************* 116 133
Total ************************************************************************************************** 138 318
Less: Valuation allowances on impaired loans ***************************************************************** 441
Impaired loans ***************************************************************************************** $134 $277
The average investment in impaired loans was $187 million, $404 million and $652 million for the years ended December 31, 2005, 2004 and
2003, respectively. Interest income on impaired loans was $12 million, $29 million and $58 million for the years ended December 31, 2005, 2004 and
2003, respectively.
The investment in restructured loans was $37 million and $125 million at December 31, 2005 and 2004, respectively. Interest income of $2 million,
$9 million and $19 million was recognized on restructured loans for the years ended December 31, 2005, 2004 and 2003, respectively. Gross interest
income that would have been recorded in accordance with the original terms of such loans amounted to $3 million, $12 million and $24 million for the
years ended December 31, 2005, 2004 and 2003, respectively.
Mortgage and consumer loans with scheduled payments of 60 days (90 days for agricultural mortgages) or more past due or in foreclosure had an
amortized cost of $60 million and $58 million at December 31, 2005 and 2004, respectively.
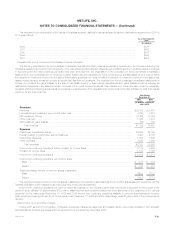
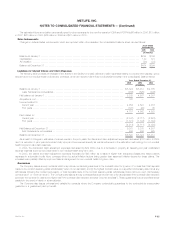
Real Estate and Real Estate Joint Ventures
Real estate and real estate joint ventures consisted of the following:
December 31,
2005 2004
(In millions)
Real estate and real estate joint ventures held-for-investment ************************************************* $4,783 $3,194
Impairments ****************************************************************************************** (118) (118)
Total ********************************************************************************************** 4,665 3,076
Real estate held-for-sale ******************************************************************************** — 1,173
Impairments ****************************************************************************************** — (16)
Total ********************************************************************************************** — 1,157
Real estate and real estate joint ventures ****************************************************************** $4,665 $4,233
MetLife, Inc.
F-26