MetLife 2005 Annual Report Download - page 17
Download and view the complete annual report
Please find page 17 of the 2005 MetLife annual report below. You can navigate through the pages in the report by either clicking on the pages listed below, or by using the keyword search tool below to find specific information within the annual report.-
 1
1 -
2
-
3
-
4
-
5
-
6
-
 7
7 -
 8
8 -
 9
9 -
 10
10 -
 11
11 -
 12
12 -
 13
13 -
 14
14 -
 15
15 -
 16
16 -
 17
17 -
 18
18 -
 19
19 -
 20
20 -
 21
21 -
 22
22 -
 23
23 -
 24
24 -
 25
25 -
 26
26 -
 27
27 -
28
-
29
-
30
-
31
-
32
-
33
-
34
-
35
-
36
-
37
-
38
-
39
-
40
-
41
-
42
-
43
-
44
-
45
-
46
-
47
-
48
-
49
-
50
-
51
-
52
-
53
-
54
-
55
-
56
-
57
-
58
-
59
-
60
-
61
-
62
-
63
-
64
-
65
-
66
-
67
-
68
-
69
-
70
-
71
-
72
-
73
-
74
-
75
-
76
-
77
-
78
-
79
-
80
-
81
-
82
-
83
-
84
-
85
-
86
-
87
-
88
-
89
-
90
-
91
-
92
-
93
-
94
-
95
-
96
-
97
-
98
-
99
-
100
-
101
-
102
-
103
-
104
-
105
-
106
-
107
-
108
-
109
-
110
-
111
-
112
-
113
-
114
-
115
-
116
-
117
-
118
-
119
-
120
-
121
-
122
-
123
-
124
-
125
-
126
-
127
-
128
-
129
-
130
-
131
-
132
-
133
 |
 |

primarily due to accelerated DAC amortization, as well as an increase in expenses associated with general business growth. The remainder of the
increase is the result of general business growth across the remaining segments and Corporate & Other.
Net investment gains (losses) increased by $726 million, or 132%, to a net investment gain of $175 million for the year ended December 31, 2004
from a net investment loss of ($551) million for the comparable 2003 period. This increase is primarily due to the more favorable economic environment in
2004.
Income tax expense for the year ended December 31, 2004 was $1,029 million, or 28% of income from continuing operations before provision for
income taxes, compared with $616 million, or 25%, for the comparable 2003 period. The 2004 effective tax rate differs from the corporate tax rate of
35% primarily due to the impact of non-taxable investment income, tax credits for investments in low income housing, a decrease in the deferred tax
valuation allowance to recognize the effect of certain foreign net operating loss carryforward in South Korea, and the contribution of appreciated stock to
the MetLife Foundation. In addition, the 2004 effective tax rate reflects an adjustment of $91 million for the resolution of all issues relating to the Internal
Revenue Service’s audit of Metropolitan Life’s and its subsidiaries’ tax returns for the years 1997-1999. Also, the 2004 effective tax rate reflects an
adjustment of $9 million consisting primarily of a revision in the estimate of income taxes for 2003. The 2003 effective tax rate differs from the corporate
tax rate of 35% primarily due to the impact of non-taxable investment income, tax credits for investments in low income housing, and tax benefits related
to the sale of foreign subsidiaries. In addition, the 2003 effective tax rate reflects an adjustment of a benefit of $36 million consisting primarily of a revision
in the estimate of income taxes for 2002.
The income from discontinued operations is comprised of the operations of SSRM and net investment income and net investment gains related to
real estate properties that the Company has classified as available-for-sale. The Company entered into an agreement to sell SSRM during the third
quarter of 2004. As previously discussed, SSRM was sold effective January 31, 2005.
Income from discontinued operations, net of income taxes, decreased $207 million, or 50%, to $207 million for the year ended December 31, 2004
from $414 million for the comparable 2003 period. The decrease is primarily due to lower recognized net investment gains from real estate properties
sold in 2004 as compared to the prior year. For the years ended December 31, 2004 and 2003, the Company recognized $146 million and $420 million
of net investment gains, respectively, from discontinued operations related to real estate properties sold or held-for-sale.
During the year ended December 31, 2004, the Company recorded an $86 million charge, net of income taxes, for a cumulative effect of a change
in accounting principle in accordance with SOP 03-1, which provides guidance on (i) the classification and valuation of long-duration contract liabilities;
(ii) the accounting for sales inducements; and (iii) separate account presentation and valuation. This charge is primarily related to those long-duration
contract liabilities where the amount of the liability is indexed to the performance of a target portfolio of investment securities. During the year ended
December 31, 2003, the Company recorded a $26 million charge, net of income taxes, for a cumulative effect of a change in accounting in accordance
with Issue B36.
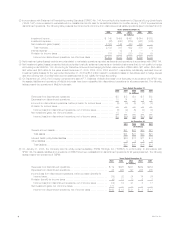
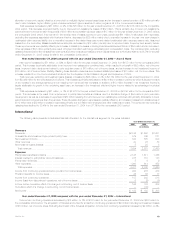
Institutional
The following table presents consolidated financial information for the Institutional segment for the years indicated:
Year Ended December 31,
2005 2004 2003
(In millions)
Revenues
Premiums****************************************************************************** $11,387 $10,037 $ 9,063
Universal life and investment-type product policy fees ***************************************** 772 711 660
Net investment income ****************************************************************** 5,962 4,582 4,146
Other revenues ************************************************************************* 653 654 618
Net investment gains (losses) ************************************************************* (10) 163 (289)
Total revenues************************************************************************ 18,764 16,147 14,198
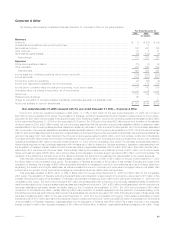
Expenses
Policyholder benefits and claims *********************************************************** 12,776 11,173 10,023
Interest credited to policyholder account balances ******************************************** 1,652 1,016 974
Policyholder dividends ******************************************************************* 1 — (1)
Other expenses ************************************************************************ 2,229 1,972 1,854
Total expenses *********************************************************************** 16,658 14,161 12,850
Income from continuing operations before provision for income taxes **************************** 2,106 1,986 1,348
Provision for income taxes**************************************************************** 706 678 485
Income from continuing operations********************************************************* 1,400 1,308 863
Income (loss) from discontinued operations, net of income taxes******************************** 162 19 49
Income before cumulative effect of a change in accounting, net of income taxes ****************** 1,562 1,327 912
Cumulative effect of a change in accounting, net of income taxes ****************************** — (60) (26)
Net income **************************************************************************** $ 1,562 $ 1,267 $ 886
Year ended December 31, 2005 compared with the year ended December 31, 2004 — Institutional
Income from continuing operations increased by $92 million, or 7%, to $1,400 million for the year ended December 31, 2005 from $1,308 million for
the comparable 2004 period. The acquisition of Travelers accounted for $73 million of this increase, which includes $57 million, net of income taxes, of
net investment losses. Excluding the impact of the Travelers acquisition, income from continuing operations increased by $19 million, or 1%, from the
comparable 2004 period. An increase in interest margins of $124 million, net of income taxes, compared to the prior year period contributed to the
increase in income from continuing operations. Management attributes this increase primarily to improvements in interest spreads for the retirement &
savings and non-medical health products of $81 million and $44 million, both net of income taxes, respectively. Higher earnings from growth in the asset
MetLife, Inc.
14