MetLife 2005 Annual Report Download - page 50
Download and view the complete annual report
Please find page 50 of the 2005 MetLife annual report below. You can navigate through the pages in the report by either clicking on the pages listed below, or by using the keyword search tool below to find specific information within the annual report.-
 1
1 -
2
-
3
-
4
-
5
-
6
-
7
-
8
-
9
-
10
-
11
-
12
-
13
-
14
-
15
-
16
-
17
-
18
-
19
-
20
-
21
-
22
-
23
-
24
-
25
-
26
-
27
-
28
-
29
-
30
-
31
-
32
-
33
-
34
-
35
-
36
-
37
-
38
-
39
-
 40
40 -
 41
41 -
 42
42 -
 43
43 -
 44
44 -
 45
45 -
 46
46 -
 47
47 -
 48
48 -
 49
49 -
 50
50 -
 51
51 -
 52
52 -
 53
53 -
 54
54 -
 55
55 -
 56
56 -
 57
57 -
 58
58 -
 59
59 -
 60
60 -
61
-
62
-
63
-
64
-
65
-
66
-
67
-
68
-
69
-
70
-
71
-
72
-
73
-
74
-
75
-
76
-
77
-
78
-
79
-
80
-
81
-
82
-
83
-
84
-
85
-
86
-
87
-
88
-
89
-
90
-
91
-
92
-
93
-
94
-
95
-
96
-
97
-
98
-
99
-
100
-
101
-
102
-
103
-
104
-
105
-
106
-
107
-
108
-
109
-
110
-
111
-
112
-
113
-
114
-
115
-
116
-
117
-
118
-
119
-
120
-
121
-
122
-
123
-
124
-
125
-
126
-
127
-
128
-
129
-
130
-
131
-
132
-
133
 |
 |

The Company records impairments as investment losses and adjusts the cost basis of the fixed maturities and equity securities accordingly. The
Company does not change the revised cost basis for subsequent recoveries in value. Impairments of fixed maturities and equity securities were
$64 million, $102 million and $355 million for the years ended December 31, 2005, 2004 and 2003, respectively. The Company’s three largest
impairments totaled $40 million, $53 million and $125 million for the years ended December 31, 2005, 2004 and 2003, respectively. The circumstances
that gave rise to these impairments were either financial restructurings or bankruptcy filings. During the years ended December 31, 2005, 2004 and
2003, the Company sold or disposed of fixed maturities and equity securities at a loss that had a fair value of $93,872 million, $29,939 million and
$21,984 million, respectively. Gross losses excluding impairments for fixed maturities and equity securities were $1,391 million, $516 million and
$500 million for the years ended December 31, 2005, 2004 and 2003, respectively.
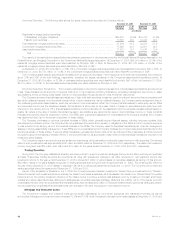
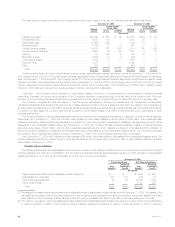
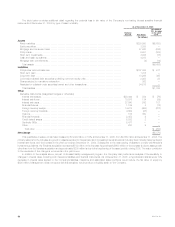
The following tables present the cost or amortized cost, gross unrealized losses and number of securities for fixed maturities and equity securities, at
December 31, 2005 and December 31, 2004, where the estimated fair value had declined and remained below cost or amortized cost by less than
20%, or 20% or more for:
December 31, 2005
Gross Unrealized Number of
Cost or Amortized Cost Losses Securities
Less than 20% or Less than 20% or Less than 20% or
20% more 20% more 20% more
(In millions, except number of securities)
Less than six months *************************************** $ 92,512 $213 $1,707 $51 11,441 308
Six months or greater but less than nine months***************** 3,704 5 108 2 456 7
Nine months or greater but less than twelve months ************* 5,006 — 133 — 573 2
Twelve months or greater ************************************ 7,555 23 240 5 924 8
Total**************************************************** $108,777 $241 $2,188 $58 13,394 325
December 31, 2004
Cost or Amortized Gross Unrealized
Cost Losses Number of Securities
Less than 20% or Less than 20% or Less than 20% or
20% more 20% more 20% more
(In millions, except number of securities)
Less than six months***************************************** $27,175 $ 79 $246 $18 3,186 117
Six months or greater but less than nine months****************** 8,477 9 111 2 687 5
Nine months or greater but less than twelve months*************** 1,595 19 33 4 206 5
Twelve months or greater ************************************* 2,798 19 80 15 395 7
Total ***************************************************** $40,045 $126 $470 $39 4,474 134
The gross unrealized loss related to the Company’s fixed maturities and equity securities at December 31, 2005 was $2,246 million. These
securities are concentrated by sector in U.S. corporates (37%); residential mortgage-backed (21%); and foreign corporates (20%); and are concentrated
by industry in mortgage-backed (30%); industrial (22%); and finance (11%) (calculated as a percentage of gross unrealized loss). Non-investment grade
securities represent 5% of the $106,772 million fair value and 8% of the $2,246 million gross unrealized loss.
The Company held one fixed maturity with a gross unrealized loss at December 31, 2005 greater than $10 million. This security represented less
than 1% of the gross unrealized loss on fixed maturities and equity securities.
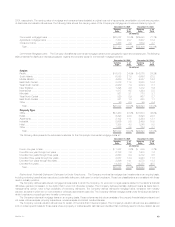
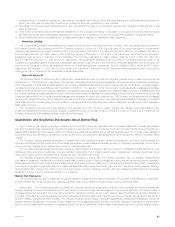
Corporate Fixed Maturities. The table below shows the major industry types that comprise the corporate fixed maturity holdings at:
December 31, 2005 December 31, 2004
Estimated % of Estimated % of
Fair Value Total Fair Value Total
(In millions)
Industrial*********************************************************************** $ 41,322 37.8% $35,785 40.1%
Foreign(1)********************************************************************** 34,981 32.0 27,469 30.8
Finance *********************************************************************** 19,189 17.5 14,481 16.3
Utility************************************************************************** 12,633 11.6 10,800 12.1
Other ************************************************************************* 1,174 1.1 654 0.7
Total ************************************************************************ $109,299 100.0% $89,189 100.0%
(1) Includes U.S. dollar-denominated debt obligations of foreign obligors, and other foreign investments.
The Company maintains a diversified corporate fixed maturity portfolio across industries and issuers. The portfolio does not have exposure to any
single issuer in excess of 1% of the total invested assets of the portfolio. At December 31, 2005 and 2004, the Company’s combined holdings in the ten
issuers to which it had the greatest exposure totaled $6,215 million and $4,967 million, respectively, each less than 3% of the Company’s total invested
assets at such dates. The exposure to the largest single issuer of corporate fixed maturities held at December 31, 2005 and 2004 was $943 million and
$631 million, respectively.
The Company has hedged all of its material exposure to foreign currency risk in its corporate fixed maturity portfolio. In the Company’s international
insurance operations, both its assets and liabilities are generally denominated in local currencies.
MetLife, Inc. 47