MetLife 2005 Annual Report Download - page 22
Download and view the complete annual report
Please find page 22 of the 2005 MetLife annual report below. You can navigate through the pages in the report by either clicking on the pages listed below, or by using the keyword search tool below to find specific information within the annual report.-
 1
1 -
2
-
3
-
4
-
5
-
6
-
7
-
8
-
9
-
10
-
11
-
 12
12 -
 13
13 -
 14
14 -
 15
15 -
 16
16 -
 17
17 -
 18
18 -
 19
19 -
 20
20 -
 21
21 -
 22
22 -
 23
23 -
 24
24 -
 25
25 -
 26
26 -
 27
27 -
 28
28 -
 29
29 -
 30
30 -
 31
31 -
 32
32 -
33
-
34
-
35
-
36
-
37
-
38
-
39
-
40
-
41
-
42
-
43
-
44
-
45
-
46
-
47
-
48
-
49
-
50
-
51
-
52
-
53
-
54
-
55
-
56
-
57
-
58
-
59
-
60
-
61
-
62
-
63
-
64
-
65
-
66
-
67
-
68
-
69
-
70
-
71
-
72
-
73
-
74
-
75
-
76
-
77
-
78
-
79
-
80
-
81
-
82
-
83
-
84
-
85
-
86
-
87
-
88
-
89
-
90
-
91
-
92
-
93
-
94
-
95
-
96
-
97
-
98
-
99
-
100
-
101
-
102
-
103
-
104
-
105
-
106
-
107
-
108
-
109
-
110
-
111
-
112
-
113
-
114
-
115
-
116
-
117
-
118
-
119
-
120
-
121
-
122
-
123
-
124
-
125
-
126
-
127
-
128
-
129
-
130
-
131
-
132
-
133
 |
 |

allocation of economic capital, offset by a lower yield on a slightly higher invested asset base and an increase in earned premium of $6 million primarily
due to rate increases, higher inflation guard endorsements and higher insurance-to-value programs, all in the homeowners business.
Total expenses decreased by $51 million, or 2%, to $2,825 million for the year ended December 31, 2005 from $2,876 million for the comparable
2004 period. This decrease is predominantly due to improved non-catastrophe losses of $32 million. This is primarily due to lower non-catastrophe
automobile and homeowner claim frequencies of $18 million and a smaller exposure base of $15 million for the year ended December 31, 2005 versus
the comparable 2004 period. Improvement in the development of losses reported in prior years contributed $61 million. Unallocated claim expenses,
excluding the expenses associated with Hurricane Katrina, decreased by $28 million mainly due to a smaller increase in the year over year change in
unallocated claim expense liability due to a smaller increase in the related loss reserve and related unallocated claim expense reserve rate. Assumed
losses from the involuntary Massachusetts automobile plan decreased by $18 million primarily due to improved claim frequency and severity trends.
These improvements were partially offset by an increase in catastrophe losses, including Hurricanes Katrina and Wilma, of $54 million and an increase in
other expenses of $33 million primarily as a result of higher information technology, advertising and compensation costs. The combined ratio, excluding
catastrophes and before the reinstatement premiums and other reinsurance-related premium adjustments due to Hurricane Katrina, is 86.7% for the year
ended December 31, 2005 versus 90.4% for the comparable 2004 period.
Year ended December 31, 2004 compared with the year ended December 31, 2003 — Auto & Home
Net income increased by $51 million, or 32%, to $208 million for the year ended December 31, 2004 from $157 million for the comparable 2003
period. This increase is primarily attributable to an improved non-catastrophe combined ratio, which resulted in a benefit of $52 million, net of income
taxes, improved claim development related to prior accident years of $61 million, net of income taxes, and an increase in net investment income of
$13 million, net of income taxes. Partially offsetting these favorable variances are increased catastrophe losses of $73 million, net of income taxes. This
increase resulted from the four hurricanes that struck the Southeastern United States in August and September of 2004.
Total revenues, excluding net investment gains (losses), increased by $55 million, or 2%, to $3,154 million for the year ended December 31, 2004
from $3,099 million for the comparable 2003 period. This increase is primarily attributable to a $40 million increase in premiums, which is largely the result
of an increase in the average earned premium resulting from continued rate increases. In addition, a $13 million increase in net investment income is
largely attributable to growth in the underlying asset base, an increase in the investment yield and higher income related to tax advantaged municipal
bonds.
Total expenses decreased by $21 million, or 1%, to $2,876 for the year ended December 31, 2004 from $2,897 million for the comparable 2003
period. This decrease is the result of an improvement in policyholder benefits and claims due to a favorable change of $94 million in prior year claim
development, as well as a decrease in expenses of $80 million resulting from an improved non-catastrophe combined ratio primarily attributable to lower
automobile and homeowners claim frequencies. These favorable changes in expenses are partially offset by an increase in losses from catastrophes of
$112 million and a $39 million increase in expenses primarily due to inflation and employee and other related labor costs. The combined ratio excluding
catastrophes declined to 90.4% for the year ended December 31, 2004 from 97.1% for the comparable 2003 period.
International
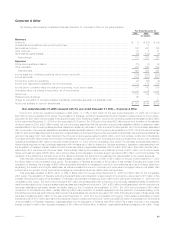
The following table presents consolidated financial information for the International segment for the years indicated:
Year Ended December 31,
2005 2004 2003
(In millions)
Revenues
Premiums ***************************************************************************************** $2,186 $1,690 $1,631
Universal life and investment-type product policy fees **************************************************** 579 349 271
Net investment income ****************************************************************************** 844 585 500
Other revenues ************************************************************************************ 20 23 80
Net investment gains (losses) ************************************************************************ 523 8
Total revenues *********************************************************************************** 3,634 2,670 2,490
Expenses
Policyholder benefits and claims ********************************************************************** 2,128 1,611 1,456
Interest credited to policyholder account balances ******************************************************* 278 151 143
Policyholder dividends******************************************************************************* 569
Other expenses ************************************************************************************ 1,000 614 652
Total expenses*********************************************************************************** 3,411 2,382 2,260
Income from continuing operations before provision for income taxes *************************************** 223 288 230
Provision (benefit) for income taxes ******************************************************************** 36 86 17
Income from continuing operations ******************************************************************** 187 202 213
Income (loss) from discontinued operations, net of income taxes ******************************************* 5 (9) (5)
Income before cumulative effect of a change in accounting, net of income taxes ***************************** 192 193 208
Cumulative effect of a change in accounting, net of income taxes ****************************************** — (30) —
Net income *************************************************************************************** $ 192 $ 163 $ 208
Year ended December 31, 2005 compared with the year ended December 31, 2004 — International
Income from continuing operations decreased by $15 million, or 7%, to $187 million for the year ended December 31, 2005 from $202 million for
the comparable 2004 period. The acquisition of Travelers accounted for a loss from continuing operations of $24 million including net investment losses
of $14 million, net of income taxes. Excluding the impact of the Travelers acquisition, income from continuing operations increased by $9 million, or 4%,
MetLife, Inc. 19