MetLife 2005 Annual Report Download - page 125
Download and view the complete annual report
Please find page 125 of the 2005 MetLife annual report below. You can navigate through the pages in the report by either clicking on the pages listed below, or by using the keyword search tool below to find specific information within the annual report.-
 1
1 -
2
-
3
-
4
-
5
-
6
-
7
-
8
-
9
-
10
-
11
-
12
-
13
-
14
-
15
-
16
-
17
-
18
-
19
-
20
-
21
-
22
-
23
-
24
-
25
-
26
-
27
-
28
-
29
-
30
-
31
-
32
-
33
-
34
-
35
-
36
-
37
-
38
-
39
-
40
-
41
-
42
-
43
-
44
-
45
-
46
-
47
-
48
-
49
-
50
-
51
-
52
-
53
-
54
-
55
-
56
-
57
-
58
-
59
-
60
-
61
-
62
-
63
-
64
-
65
-
66
-
67
-
68
-
69
-
70
-
71
-
72
-
73
-
74
-
75
-
76
-
77
-
78
-
79
-
80
-
81
-
82
-
83
-
84
-
85
-
86
-
87
-
88
-
89
-
90
-
91
-
92
-
93
-
94
-
95
-
96
-
97
-
98
-
99
-
100
-
101
-
102
-
103
-
104
-
105
-
106
-
107
-
108
-
109
-
110
-
111
-
112
-
113
-
114
-
 115
115 -
 116
116 -
 117
117 -
 118
118 -
 119
119 -
 120
120 -
 121
121 -
 122
122 -
 123
123 -
 124
124 -
 125
125 -
 126
126 -
 127
127 -
 128
128 -
 129
129 -
 130
130 -
 131
131 -
 132
132 -
 133
133
 |
 |

METLIFE, INC.
NOTES TO CONSOLIDATED FINANCIAL STATEMENTS — (Continued)
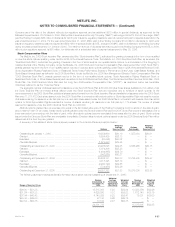
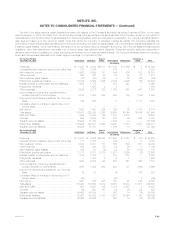
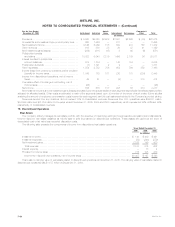
Set forth in the tables below is certain financial information with respect to the Company’s segments, as well as Corporate & Other, for the years
ended December 31, 2005, 2004 and 2003. The accounting policies of the segments are the same as those of the Company, except for the method of
capital allocation and the accounting for gains (losses) from intercompany sales, which are eliminated in consolidation. The Company allocates capital to
each segment based upon the economic capital model that allows the Company to effectively manage its capital. The Company evaluates the
performance of each operating segment based upon net income excluding net investment gains (losses), net of income taxes, adjustments related to net
investment gains (losses), net of income taxes, the impact from the cumulative effect of changes in accounting, net of income taxes and discontinued
operations, other than discontinued real estate, net of income taxes, less preferred stock dividends. Scheduled periodic settlement payments on
derivative instruments not qualifying for hedge accounting are included in net investment gains (losses). The Company allocates certain non-recurring
items, such as expenses associated with certain legal proceedings, to Corporate & Other.
For the Year Ended Auto & Corporate &
December 31, 2005 Institutional Individual Home International Reinsurance Other Total
(In millions)
Premiums ************************************* $ 11,387 $ 4,502 $2,911 $ 2,186 $ 3,869 $ 5 $ 24,860
Universal life and investment-type product policy fees 772 2,476 — 579 — 1 3,828
Net investment income ************************** 5,962 6,535 181 844 606 782 14,910
Other revenues ******************************** 653 477 33 20 58 30 1,271
Net investment gains (losses)********************* (10) (50) (12) 5 22 (48) (93)
Policyholder benefits and claims ****************** 12,776 5,420 1,994 2,128 3,206 (18) 25,506
Interest credited to policyholder account balances *** 1,652 1,775 — 278 220 — 3,925
Policyholder dividends *************************** 1 1,670 3 5 — — 1,679
Other expenses ******************************** 2,229 3,272 828 1,000 991 947 9,267
Income (loss) from continuing operations before
provision (benefit) for income taxes ************** 2,106 1,803 288 223 138 (159) 4,399
Income from discontinued operations, net of income
taxes *************************************** 162 295 — 5 — 1,113 1,575
Cumulative effect of a change in accounting, net of
income taxes ******************************** ———— — — —
Net income************************************ 1,562 1,503 224 192 92 1,141 4,714
Total assets *********************************** 176,401 228,325 5,397 18,624 16,049 36,849 481,645
DAC and VOBA ******************************** 1,259 13,540 186 1,841 2,815 — 19,641
Goodwill ************************************** 959 2,903 157 288 96 394 4,797
Separate account assets ************************ 45,239 81,070 — 1,546 14 — 127,869
Policyholder liabilities **************************** 105,998 120,031 3,490 13,260 11,751 7,841 262,371
Separate account liabilities *********************** 45,239 81,070 — 1,546 14 — 127,869
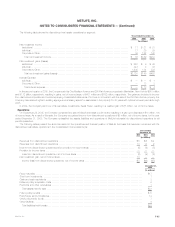
For the Year Ended Auto & Corporate &
December 31, 2004 Institutional Individual Home International Reinsurance Other Total
(In millions)
Premiums ************************************* $ 10,037 $ 4,204 $2,948 $ 1,690 $ 3,348 $ (27) $ 22,200
Universal life and investment-type product policy fees 711 1,805 — 349 — 2 2,867
Net investment income ************************** 4,582 6,031 171 585 538 457 12,364
Other revenues ******************************** 654 422 35 23 56 8 1,198
Net investment gains (losses)********************* 163 91 (9) 23 59 (152) 175
Policyholder benefits and claims ****************** 11,173 5,107 2,079 1,611 2,694 (2) 22,662
Interest credited to policyholder account balances *** 1,016 1,618 — 151 212 — 2,997
Policyholder dividends *************************** — 1,657 2 6 1 — 1,666
Other expenses ******************************** 1,972 2,879 795 614 957 596 7,813
Income (loss) from continuing operations before
provision (benefit) for income taxes ************** 1,986 1,292 269 288 137 (306) 3,666
Income from discontinued operations, net of income
taxes *************************************** 19 21 — (9) — 176 207
Cumulative effect of a change in accounting, net of
income taxes ******************************** (60) — — (30) — 4 (86)
Net income************************************ 1,267 885 208 163 91 144 2,758
Total assets *********************************** 133,441 170,554 6,410 13,838 15,214 17,351 356,808
DAC and VOBA ******************************** 997 9,297 185 1,278 2,567 3 14,327
Goodwill ************************************** 64 200 157 92 96 24 633
Separate account assets ************************ 40,462 45,384 — 923 14 (14) 86,769
Policyholder liabilities **************************** 72,967 100,332 3,180 8,001 10,464 1,848 196,792
Separate account liabilities *********************** 40,462 45,384 — 923 14 (14) 86,769
MetLife, Inc. F-63