MetLife 2005 Annual Report Download - page 48
Download and view the complete annual report
Please find page 48 of the 2005 MetLife annual report below. You can navigate through the pages in the report by either clicking on the pages listed below, or by using the keyword search tool below to find specific information within the annual report.-
 1
1 -
2
-
3
-
4
-
5
-
6
-
7
-
8
-
9
-
10
-
11
-
12
-
13
-
14
-
15
-
16
-
17
-
18
-
19
-
20
-
21
-
22
-
23
-
24
-
25
-
26
-
27
-
28
-
29
-
30
-
31
-
32
-
33
-
34
-
35
-
36
-
37
-
 38
38 -
 39
39 -
 40
40 -
 41
41 -
 42
42 -
 43
43 -
 44
44 -
 45
45 -
 46
46 -
 47
47 -
 48
48 -
 49
49 -
 50
50 -
 51
51 -
 52
52 -
 53
53 -
 54
54 -
 55
55 -
 56
56 -
 57
57 -
 58
58 -
59
-
60
-
61
-
62
-
63
-
64
-
65
-
66
-
67
-
68
-
69
-
70
-
71
-
72
-
73
-
74
-
75
-
76
-
77
-
78
-
79
-
80
-
81
-
82
-
83
-
84
-
85
-
86
-
87
-
88
-
89
-
90
-
91
-
92
-
93
-
94
-
95
-
96
-
97
-
98
-
99
-
100
-
101
-
102
-
103
-
104
-
105
-
106
-
107
-
108
-
109
-
110
-
111
-
112
-
113
-
114
-
115
-
116
-
117
-
118
-
119
-
120
-
121
-
122
-
123
-
124
-
125
-
126
-
127
-
128
-
129
-
130
-
131
-
132
-
133
 |
 |

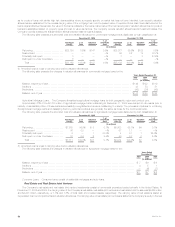
(6) Investment income from other invested assets includes scheduled periodic settlement payments on derivative instruments that do not qualify for
hedge accounting under SFAS 133 of $99 million, $51 million and $84 million for the years ended December 31, 2005, 2004 and 2003,
respectively. These amounts are excluded from net investment gains (losses). Additionally, excluded from net investment gains (losses) for year
ended December 31, 2005 is ($13) million related to revaluation losses on derivatives used to hedge interest rate and currency risk on policyholder
account balances that do not qualify for hedge accounting.
(7) Included in net investment gains (losses) from other invested assets for the year ended December 31, 2004 is a charge of $26 million related to a
funds withheld reinsurance treaty that was converted to a coinsurance agreement. This amount is classified in net investment income in the
consolidated statements of income.
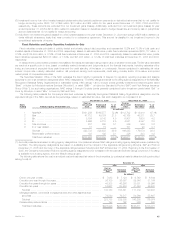
Fixed Maturities and Equity Securities Available-for-Sale
Fixed maturities consist principally of publicly traded and privately placed debt securities, and represented 75.2% and 73.8% of total cash and
invested assets at December 31, 2005 and 2004, respectively. Based on estimated fair value, public fixed maturities represented $200,177 million, or
87.0%, and $154,439 million, or 87.6%, of total fixed maturities at December 31, 2005 and 2004, respectively. Based on estimated fair value, private
fixed maturities represented $29,873 million, or 13.0%, and $21,938 million, or 12.4%, of total fixed maturities at December 31, 2005 and 2004,
respectively.
In cases where quoted market prices are not available, fair values are estimated using present value or valuation techniques. The fair value estimates
are made at a specific point in time, based on available market information and judgments about the financial instruments, including estimates of the
timing and amounts of expected future cash flows and the credit standing of the issuer or counterparty. Factors considered in estimating fair value
include: coupon rate, maturity, estimated duration, call provisions, sinking fund requirements, credit rating, industry sector of the issuer and quoted
market prices of comparable securities.
The Securities Valuation Office of the NAIC evaluates the fixed maturity investments of insurers for regulatory reporting purposes and assigns
securities to one of six investment categories called ‘‘NAIC designations.’’ The NAIC ratings are similar to the rating agency designations of the Nationally
Recognized Statistical Rating Organizations for marketable bonds. NAIC ratings 1 and 2 include bonds generally considered investment grade (rated
‘‘Baa3’’ or higher by Moody’s Investors Services (‘‘Moody’s’’), or rated ‘‘BBB—’’ or higher by Standard & Poor’s (‘‘S&P’’) and Fitch Ratings Insurance
Group (‘‘Fitch’’)), by such rating organizations. NAIC ratings 3 through 6 include bonds generally considered below investment grade (rated ‘‘Ba1’’ or
lower by Moody’s, or rated ‘‘BB+’’ or lower by S&P and Fitch).
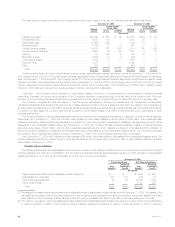
The following table presents the Company’s total fixed maturities by Nationally Recognized Statistical Rating Organizations designation and the
equivalent ratings of the NAIC, as well as the percentage, based on estimated fair value, that each designation is comprised of at:
December 31, 2005 December 31, 2004
Cost or Cost or
NAIC Amortized Estimated % of Amortized Estimated % of
Rating Rating Agency Designation (1) Cost Fair Value Total Cost Fair Value Total
(In millions)
1 Aaa/Aa/A ******************************* $161,256 $165,577 72.0% $112,702 $118,410 67.1%
2 Baa ************************************ 47,712 49,124 21.3 42,165 45,311 25.7
3Ba************************************* 8,794 9,142 4.0 6,907 7,500 4.2
4B************************************** 5,666 5,710 2.5 4,081 4,397 2.5
5 Caa and lower *************************** 287 290 0.1 329 366 0.2
6 In or near default ************************* 18 15 — 101 90 0.1
Subtotal ******************************** 223,733 229,858 99.9 166,285 176,074 99.8
Redeemable preferred stock *************** 193 192 0.1 326 303 0.2
Total fixed maturities ********************** $223,926 $230,050 100.0% $166,611 $176,377 100.0%
(1) Amounts presented are based on rating agency designations. Comparisons between NAIC ratings and rating agency designations are published by
the NAIC. The rating agency designations are based on availability and the midpoint of the applicable ratings among Moody’s, S&P and Fitch at
December 31, 2005 and the lower of the applicable ratings between Moody’s and S&P at December 31, 2004. Beginning in the third quarter of
2005, the Company incorporated Fitch into its rating agency designations to be consistent with the Lehman Brothers’ ratings convention. If no rating
is available from a rating agency, then the MetLife rating is used.
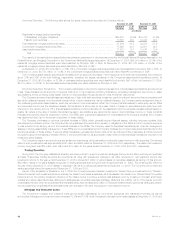
The following table shows the cost or amortized cost and estimated fair value of fixed maturities, by contractual maturity dates (excluding scheduled
sinking funds) at:
December 31,
2005 2004
Cost or Cost or
Amortized Estimated Amortized Estimated
Cost Fair Value Cost Fair Value
(In millions)
Due in one year or less ************************************************** $ 7,083 $ 7,124 $ 6,749 $ 6,844
Due after one year through five years *************************************** 36,100 36,557 29,846 31,164
Due after five years through ten years ************************************** 45,303 46,256 33,531 35,996
Due after ten years ****************************************************** 58,667 63,404 41,593 46,463
Subtotal ************************************************************* 147,153 153,341 111,719 120,467
Mortgage-backed, commercial mortgage-backed and other asset-backed
securities ************************************************************ 76,580 76,517 54,566 55,607
Subtotal ************************************************************* 223,733 229,858 166,285 176,074
Redeemable preferred stock ********************************************** 193 192 326 303
Total fixed maturities *************************************************** $223,926 $230,050 $166,611 $176,377
MetLife, Inc. 45