MetLife 2005 Annual Report Download - page 55
Download and view the complete annual report
Please find page 55 of the 2005 MetLife annual report below. You can navigate through the pages in the report by either clicking on the pages listed below, or by using the keyword search tool below to find specific information within the annual report.-
 1
1 -
2
-
3
-
4
-
5
-
6
-
7
-
8
-
9
-
10
-
11
-
12
-
13
-
14
-
15
-
16
-
17
-
18
-
19
-
20
-
21
-
22
-
23
-
24
-
25
-
26
-
27
-
28
-
29
-
30
-
31
-
32
-
33
-
34
-
35
-
36
-
37
-
38
-
39
-
40
-
41
-
42
-
43
-
44
-
 45
45 -
 46
46 -
 47
47 -
 48
48 -
 49
49 -
 50
50 -
 51
51 -
 52
52 -
 53
53 -
 54
54 -
 55
55 -
 56
56 -
 57
57 -
 58
58 -
 59
59 -
 60
60 -
 61
61 -
 62
62 -
 63
63 -
 64
64 -
 65
65 -
66
-
67
-
68
-
69
-
70
-
71
-
72
-
73
-
74
-
75
-
76
-
77
-
78
-
79
-
80
-
81
-
82
-
83
-
84
-
85
-
86
-
87
-
88
-
89
-
90
-
91
-
92
-
93
-
94
-
95
-
96
-
97
-
98
-
99
-
100
-
101
-
102
-
103
-
104
-
105
-
106
-
107
-
108
-
109
-
110
-
111
-
112
-
113
-
114
-
115
-
116
-
117
-
118
-
119
-
120
-
121
-
122
-
123
-
124
-
125
-
126
-
127
-
128
-
129
-
130
-
131
-
132
-
133
 |
 |

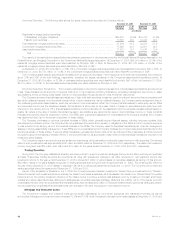
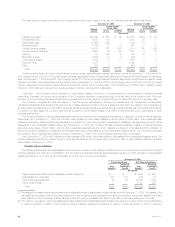
The table below provides a summary of the notional amount and current market or fair value of derivative financial instruments held at:
December 31, 2005 December 31, 2004
Current Market Current Market
or Fair Value or Fair Value
Notional Notional
Amount Assets Liabilities Amount Assets Liabilities
(In millions)
Interest rate swaps***************************************** $20,444 $ 653 $ 69 $12,681 $284 $ 22
Interest rate floors****************************************** 10,975 134 — 3,325 38 —
Interest rate caps ****************************************** 27,990 242 — 7,045 12 —
Financial futures ******************************************* 1,159 12 8 611 — 13
Foreign currency swaps ************************************ 14,274 527 991 8,214 150 1,302
Foreign currency forwards*********************************** 4,622 64 92 1,013 5 57
Options ************************************************** 815 356 6 263 37 7
Financial forwards****************************************** 2,452 13 4 326 — —
Credit default swaps *************************************** 5,882 13 11 1,897 11 5
Synthetic GICs ******************************************** 5,477 — — 5,869 — —
Other **************************************************** 250 9 — 450 1 1
Total*************************************************** $94,340 $2,023 $1,181 $41,694 $538 $1,407
The above table does not include notional values for equity futures, equity financial forwards, and equity options. At December 31, 2005 and 2004,
the Company owned 3,305 and 776 equity futures contracts, respectively. Equity futures market values are included in financial futures in the preceding
table. At December 31, 2005 and 2004, the Company owned 213,000 and no equity financial forwards, respectively. Equity financial forwards market
values are included in financial forwards in the preceding table. At December 31, 2005 and 2004, the Company owned 4,720,254 and 493,358 equity
options, respectively. Equity options market values are included in options in the preceding table. The notional amount of $562 million, related to equity
options for 2004 has been removed from the above table to conform with the 2005 presentation.
Credit Risk. The Company may be exposed to credit related losses in the event of nonperformance by counterparties to derivative financial
instruments. Generally, the current credit exposure of the Company’s derivative contracts is limited to the fair value at the reporting date. The credit
exposure of the Company’s derivative transactions is represented by the fair value of contracts with a net positive fair value at the reporting date.
The Company manages its credit risk related to over-the-counter derivatives by entering into transactions with creditworthy counterparties,
maintaining collateral arrangements and through the use of master agreements that provide for a single net payment to be made by one counterparty to
another at each due date and upon termination. Because exchange traded futures are effected through regulated exchanges, and positions are marked
to market on a daily basis, the Company has minimal exposure to credit related losses in the event of nonperformance by counterparties to such
derivative instruments.
The Company enters into various collateral arrangements, which require both the pledging and accepting of collateral in connection with its derivative
instruments. As of December 31, 2005, the Company was obligated to return cash collateral under its control of $195 million. This unrestricted cash
collateral is included in cash and cash equivalents and the obligation to return it is included in payables for collateral under securities loaned and other
transactions in the consolidated balance sheet. As of December 31, 2005, the Company had also accepted collateral consisting of various securities
with a fair market value of $427 million, which is held in separate custodial accounts. Such collateral is included in other assets and the obligation to
return it is included in payables for collateral under securities loaned and other transactions in the consolidated balance sheet. The Company is permitted
by contract to sell or repledge this collateral, but as of December 31, 2005, none of the collateral had been sold or repledged.
As of December 31, 2005, the Company provided collateral of $4 million, which is included in other assets in the consolidated balance sheet. The
counterparties are permitted by contract to sell or repledge this collateral. The Company did not have any cash or other collateral related to derivative
instruments at December 31, 2004.
Variable Interest Entities
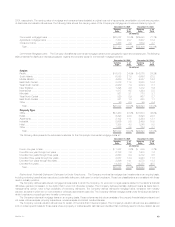
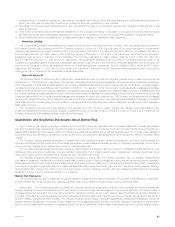
The following table presents the total assets of and maximum exposure to loss relating to VIEs for which the Company has concluded that (i) it is the
primary beneficiary and which are consolidated in the Company’s consolidated financial statements at December 31, 2005; and (ii) it holds significant
variable interests but it is not the primary beneficiary and which have not been consolidated:
December 31, 2005
Primary Beneficiary Not Primary Beneficiary
Maximum Maximum
Total Exposure to Total Exposure to
Assets(1) Loss(2) Assets(1) Loss(2)
(In millions)
Asset-backed securitizations and collateralized debt obligations ******************* $ — $ — $ 3,728 $ 463
Real estate joint ventures(3) ************************************************* 304 114 246 19
Other limited partnerships(4) ************************************************* 48 35 15,760 2,109
Other investments(5) ******************************************************* — — 3,722 242
Total******************************************************************* $352 $149 $23,456 $2,833
(1) The assets of the asset-backed securitizations and collateralized debt obligations are reflected at fair value at December 31, 2005. The assets of the
real estate joint ventures, other limited partnerships and other investments are reflected at the carrying amounts at which such assets would have
been reflected on the Company’s balance sheet had the Company consolidated the VIE from the date of its initial investment in the entity.
(2) The maximum exposure to loss of the asset-backed securitizations and collateralized debt obligations is equal to the carrying amounts of participation
or retained interests. In addition, the Company provides collateral management services for certain of these structures for which it collects a
MetLife, Inc.
52