MetLife 2005 Annual Report Download - page 24
Download and view the complete annual report
Please find page 24 of the 2005 MetLife annual report below. You can navigate through the pages in the report by either clicking on the pages listed below, or by using the keyword search tool below to find specific information within the annual report.-
 1
1 -
2
-
3
-
4
-
5
-
6
-
7
-
8
-
9
-
10
-
11
-
12
-
13
-
 14
14 -
 15
15 -
 16
16 -
 17
17 -
 18
18 -
 19
19 -
 20
20 -
 21
21 -
 22
22 -
 23
23 -
 24
24 -
 25
25 -
 26
26 -
 27
27 -
 28
28 -
 29
29 -
 30
30 -
 31
31 -
 32
32 -
 33
33 -
 34
34 -
35
-
36
-
37
-
38
-
39
-
40
-
41
-
42
-
43
-
44
-
45
-
46
-
47
-
48
-
49
-
50
-
51
-
52
-
53
-
54
-
55
-
56
-
57
-
58
-
59
-
60
-
61
-
62
-
63
-
64
-
65
-
66
-
67
-
68
-
69
-
70
-
71
-
72
-
73
-
74
-
75
-
76
-
77
-
78
-
79
-
80
-
81
-
82
-
83
-
84
-
85
-
86
-
87
-
88
-
89
-
90
-
91
-
92
-
93
-
94
-
95
-
96
-
97
-
98
-
99
-
100
-
101
-
102
-
103
-
104
-
105
-
106
-
107
-
108
-
109
-
110
-
111
-
112
-
113
-
114
-
115
-
116
-
117
-
118
-
119
-
120
-
121
-
122
-
123
-
124
-
125
-
126
-
127
-
128
-
129
-
130
-
131
-
132
-
133
 |
 |

the 2004 impact is a decline in the fair value of the underlying assets associated with these contracts. Additionally, a $10 million, net of income taxes,
increase in net investment gains is primarily due to the gain from the sale of the Spanish operations. In addition, 2004 includes $8 million of certain tax-
related benefits in South Korea. The remainder of the increase can be attributed to business growth in other countries. Additionally, $8 million of the
decrease in income from continuing operations is due to changes in the foreign currency exchange rates.
Total revenues, excluding net investment gains (losses), increased by $165 million, or 7%, to $2,647 million for the year ended December 31, 2004
from $2,482 million for the comparable 2003 period. The prior year period includes $230 million of revenues related to the Spanish operations, which
were sold in 2003. Excluding the sale of these operations, revenues increased by $395 million, or 18%. The Company’s Mexican and Chilean operations
increased revenues by $144 million and $58 million, respectively, primarily due to growth in the business, as well as improved investment earnings. The
Company’s operations in South Korea and Taiwan also have increased revenues by $121 million and $34 million, respectively, primarily due to increased
new sales and renewal business. The remainder of the increase can be attributed to business growth in other countries. Changes in foreign currency
exchange rates contributed $14 million to the year over year increase in total revenues.
Total expenses increased by $122 million, or 5%, to $2,382 million for the year ended December 31, 2004 from $2,260 million for the comparable
2003 period. The prior year includes expenses of $223 million related to the Spanish operations, which were sold in 2003. The prior year also includes a
$79 million benefit related to a reduction in the Mexican operation’s policyholder liabilities resulting from a change in methodology in determining the
liability for future policy benefits, partially offset by a related increase of $45 million in amortization of VOBA. Additionally, Taiwan’s 2003 expenses include
a $30 million pre-tax charge due to an increased loss recognition reserve as a result of low interest rates relative to product guarantees. Excluding these
items, expenses increased $341 million, or 17%, over the prior year. Expenses grew by $71 million, $98 million, $58 million and $36 million for the
operations in Mexico, South Korea, Chile and Taiwan, respectively, which is commensurate with the revenue growth discussed above. In addition, 2004
includes a $33 million decrease in Mexico’s policyholder liabilities resulting from the application of SOP 03-1. Canada’s expenses increased by
$13 million due primarily to the strengthening of the liability on its pension business related to changes in mortality assumptions in the fourth quarter of
2004. The remainder of the increase in total expenses is primarily related to the ongoing investment in infrastructure. Changes in foreign currency
exchange rates contributed $18 million to the year over year increase in total expenses.
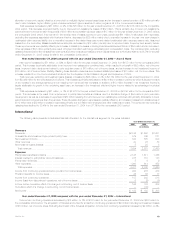
Reinsurance
The following table presents consolidated financial information for the Reinsurance segment for the years indicated:
Year Ended December 31,
2005 2004 2003
(In millions)
Revenues
Premiums ***************************************************************************************** $3,869 $3,348 $2,648
Universal life and investment-type product policy fees **************************************************** ———
Net investment income ****************************************************************************** 606 538 431
Other revenues ************************************************************************************ 58 56 47
Net investment gains (losses) ************************************************************************ 22 59 62
Total revenues *********************************************************************************** 4,555 4,001 3,188
Expenses
Policyholder benefits and claims ********************************************************************** 3,206 2,694 2,109
Interest credited to policyholder account balances ******************************************************* 220 212 184
Policyholder dividends******************************************************************************* —1—
Other expenses ************************************************************************************ 991 957 764
Total expenses*********************************************************************************** 4,417 3,864 3,057
Income before provision for income taxes ************************************************************** 138 137 131
Provision for income taxes *************************************************************************** 46 46 45
Net income *************************************************************************************** $92 $91 $86
Year ended December 31, 2005 compared with the year ended December 31, 2004 — Reinsurance
Net income increased by $1 million, or 1%, to $92 million for the year ended December 31, 2005 from $91 million for the comparable 2004 period.
This increase is attributable to a 14% increase in revenues, primarily due to new premiums from facultative and automatic treaties and renewal premiums
on existing blocks of business in the U.S. and international operations, as well as an increase in net investment income due to growth in RGA’s
operations and invested asset base. The increase in net income is partially offset by a reduction in net investment gains of $12 million, net of income
taxes and minority interest, and a higher loss ratio in the current year, primarily due to unfavorable mortality experience as a result of high claim levels in
the U.S. and the U.K. during the first six months of the year. Reserve strengthening in RGA’s Argentine pension business in 2005 reduced net income by
$11 million, net of income taxes and minority interest. The comparable 2004 period included a negotiated claim settlement in RGA’s accident and health
business, reducing net income by $8 million, net of income taxes and minority interest. The Argentine pension business and the accident and health
business are currently in run-off.
Total revenues, excluding net investment gains (losses), increased by $591 million, or 15%, to $4,533 million for the year ended December 31,
2005 from $3,942 million for the comparable 2004 period primarily due to a $521 million, or 16%, increase in premiums and a $68 million, or 13%,
increase in net investment income. New premiums from facultative and automatic treaties and renewal premiums on existing blocks of business in the
U.S. and international operations contributed to the premium growth. Premium levels are significantly influenced by large transactions and reporting
practices of ceding companies and, as a result, can fluctuate from period to period. The growth in net investment income is the result of the growth in
RGA’s operations and invested asset base. Additionally, a component of the total revenue increase is attributable to foreign currency exchange rate
movements contributing an estimated $49 million.
MetLife, Inc. 21