MetLife 2005 Annual Report Download - page 40
Download and view the complete annual report
Please find page 40 of the 2005 MetLife annual report below. You can navigate through the pages in the report by either clicking on the pages listed below, or by using the keyword search tool below to find specific information within the annual report.-
 1
1 -
2
-
3
-
4
-
5
-
6
-
7
-
8
-
9
-
10
-
11
-
12
-
13
-
14
-
15
-
16
-
17
-
18
-
19
-
20
-
21
-
22
-
23
-
24
-
25
-
26
-
27
-
28
-
29
-
 30
30 -
 31
31 -
 32
32 -
 33
33 -
 34
34 -
 35
35 -
 36
36 -
 37
37 -
 38
38 -
 39
39 -
 40
40 -
 41
41 -
 42
42 -
 43
43 -
 44
44 -
 45
45 -
 46
46 -
 47
47 -
 48
48 -
 49
49 -
 50
50 -
51
-
52
-
53
-
54
-
55
-
56
-
57
-
58
-
59
-
60
-
61
-
62
-
63
-
64
-
65
-
66
-
67
-
68
-
69
-
70
-
71
-
72
-
73
-
74
-
75
-
76
-
77
-
78
-
79
-
80
-
81
-
82
-
83
-
84
-
85
-
86
-
87
-
88
-
89
-
90
-
91
-
92
-
93
-
94
-
95
-
96
-
97
-
98
-
99
-
100
-
101
-
102
-
103
-
104
-
105
-
106
-
107
-
108
-
109
-
110
-
111
-
112
-
113
-
114
-
115
-
116
-
117
-
118
-
119
-
120
-
121
-
122
-
123
-
124
-
125
-
126
-
127
-
128
-
129
-
130
-
131
-
132
-
133
 |
 |

Assumed health care cost trend rates may have a significant effect on the amounts reported for health care plans. A one-percentage point change in
assumed health care cost trend rates would have the following effects:
One Percent One Percent
Increase Decrease
(In millions)
Effect on total of service and interest cost components *********************************************** $ 15 $ (12)
Effect of accumulated postretirement benefit obligation************************************************ $182 $(153)
A decrease (increase) in the discount rate increases (decreases) the accumulated postretirement benefit obligation. This increase is amortized into
earnings as an actuarial loss (gain). Based on the December 31, 2005 APBO, a 25 basis point decrease (increase) in the discount rate would result in an
increase (decrease) in the APBO of approximately $65 million.
Changes in discount rates are amortized into earnings as actuarial gains and losses. At the end of 2005, total unrecognized actuarial losses were
$377 million, as compared to $199 million in 2004. The majority of the unrecognized actuarial losses are due to declining discount rates, an increase in
expected health care inflation and changes in demographic assumptions. These losses will be amortized on a straight-line basis over the average
remaining service period of active employees expected to receive benefits under the postretirement benefit plans. At the end of 2005, the average
remaining service period of active employees was 10.1 years for the postretirement benefit plans.
The Company expects to receive subsidies on prescription drug benefits beginning in 2006 under the Medicare Prescription Drug, Improvement
and Modernization Act of 2003 (the ‘‘Prescription Drug Act’’). The other postretirement benefit plan accumulated benefit obligation was remeasured
effective July 1, 2004 in order to determine the effect of the expected subsidies on net periodic postretirement benefit cost. As a result, the accumulated
postretirement benefit obligation was reduced by $213 million at July 1, 2004 and net periodic postretirement benefit cost from July 1, 2004 through
December 31, 2004 was reduced by $17 million. The reduction of net periodic benefit cost was due to reductions in service cost of $3 million, interest
cost of $6 million, and amortization of prior actuarial loss of $8 million.
The reduction in the accumulated postretirement benefit obligation related to the Prescription Drug Act was $298 million and $230 million as of
December 31, 2005 and 2004, respectively. For the year ended December 31, 2005, the reduction of net periodic postretirement benefit cost was
$45 million, which was due to reductions in service cost of $6 million, interest cost of $16 million and amortization of prior actuarial loss of $23 million. An
additional $23 million reduction in the December 31, 2005 accumulated postretirement benefit plan obligation is the result of an acturial loss recognized
during the year resulting from updated assumptions including a January 1, 2005 participant census and new claims cost experience and the effect of a
December 31, 2005 change in the discount rate.
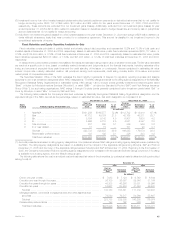
Pension and Postretirement Net Periodic Benefit Cost
Pension Cost
Net periodic pension cost is comprised of the following:
1) Service Cost — Service cost is the increase in the projected pension benefit obligation resulting from benefits payable to employees of the
Subsidiaries on service rendered during the current year.
2) Interest Cost on the Liability — Interest cost is the time value adjustment on the projected pension benefit obligation at the end of each year.
3) Expected Return on Plan Assets — Expected return on plan assets is the assumed return earned by the accumulated pension fund assets in a
particular year.
4) Amortization of Unrecognized Prior Service Cost — This cost relates to the increase or decrease to pension benefit cost for service provided in
prior years due to amendments in plans or initiation of new plans. As the economic benefits of these costs are realized in the future periods these
costs are amortized to pension expense over the expected service years of the employees.
5) Amortization of Actuarial Loss — The amortization of actuarial loss comprises of differences between the actual experience and the expected
experience on pension plan assets or projected benefit obligation at the end of each year and the amortization of the unrecognized net gain or
loss from prior periods.
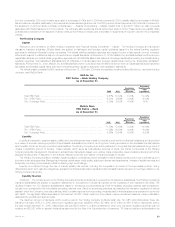
The Subsidiaries recognized pension expense of $146 million in 2005 as compared to $129 million in 2004 and $214 million in 2003. The major
components of net periodic pension cost described above are as follows:
Pension Benefits
2005 2004 2003
(In millions)
Service cost ****************************************************************************************** $ 142 $ 129 $ 123
Interest cost ****************************************************************************************** 318 311 314
Expected return on plan assets ************************************************************************** (446) (428) (335)
Amortization of prior actuarial losses ********************************************************************** 116 101 86
Amortization of prior service cost ************************************************************************* 16 16 16
Curtailment cost *************************************************************************************** ——10
Net periodic benefit cost ******************************************************************************** $ 146 $ 129 $ 214
The increase in expense was primarily a result of both increase in service cost and amortization of actuarial losses resulting largely from a declining
discount rate, partially offset by the impact of an increase in the expected rates of return on plan assets.
The weighted average discount rate used to calculate the net periodic pension cost was 5.83%, 6.10% and 6.74% for the years ended
December 31, 2005, 2004 and 2003, respectively.
The expected rate of return on pension plan assets used to calculate the net periodic pension cost for the years ended December 31, 2005, 2004
and 2003 was 8.50%, 8.50% and 8.51%, respectively. The expected rate of return on plan assets is based on anticipated performance of the various
asset sectors in which the plan invests, weighted by target allocation percentages. Anticipated future performance is based on long-term historical
returns of the plan assets by sector, adjusted for the Subsidiaries’ long-term expectations on the performance of the markets. While the precise expected
return derived using this approach will fluctuate from year to year, the Subsidiaries’ policy is to hold this long-term assumption constant as long as it
remains within reasonable tolerance from the derived rate. The actual net return on the investments has been an approximation of the estimated return for
MetLife, Inc. 37