MetLife 2005 Annual Report Download - page 16
Download and view the complete annual report
Please find page 16 of the 2005 MetLife annual report below. You can navigate through the pages in the report by either clicking on the pages listed below, or by using the keyword search tool below to find specific information within the annual report.-
 1
1 -
2
-
3
-
4
-
5
-
 6
6 -
 7
7 -
 8
8 -
 9
9 -
 10
10 -
 11
11 -
 12
12 -
 13
13 -
 14
14 -
 15
15 -
 16
16 -
 17
17 -
 18
18 -
 19
19 -
 20
20 -
 21
21 -
 22
22 -
 23
23 -
 24
24 -
 25
25 -
 26
26 -
27
-
28
-
29
-
30
-
31
-
32
-
33
-
34
-
35
-
36
-
37
-
38
-
39
-
40
-
41
-
42
-
43
-
44
-
45
-
46
-
47
-
48
-
49
-
50
-
51
-
52
-
53
-
54
-
55
-
56
-
57
-
58
-
59
-
60
-
61
-
62
-
63
-
64
-
65
-
66
-
67
-
68
-
69
-
70
-
71
-
72
-
73
-
74
-
75
-
76
-
77
-
78
-
79
-
80
-
81
-
82
-
83
-
84
-
85
-
86
-
87
-
88
-
89
-
90
-
91
-
92
-
93
-
94
-
95
-
96
-
97
-
98
-
99
-
100
-
101
-
102
-
103
-
104
-
105
-
106
-
107
-
108
-
109
-
110
-
111
-
112
-
113
-
114
-
115
-
116
-
117
-
118
-
119
-
120
-
121
-
122
-
123
-
124
-
125
-
126
-
127
-
128
-
129
-
130
-
131
-
132
-
133
 |
 |
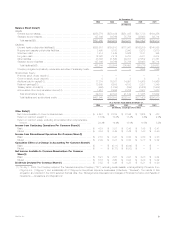
income and tax credits for investments in low income housing. In addition, the 2005 effective tax rate reflects a tax benefit of $27 million related to the
repatriation of foreign earnings pursuant to Internal Revenue Code Section 965 for which a U.S. deferred tax provision had previously been recorded and
an adjustment of a benefit of $31 million consisting primarily of a revision in the estimate of income taxes for 2004 had been made. The 2004 effective tax
rate differs from the corporate tax rate of 35% primarily due to the impact of non-taxable investment income, tax credits for investments in low income
housing, a decrease in the deferred tax valuation allowance to recognize the effect of certain foreign net operating loss carryforwards in South Korea, and
the contribution of appreciated stock to the MetLife Foundation. In addition, the 2004 effective tax rate reflects an adjustment for the resolution of all
issues relating to the Internal Revenue Service’s audit of Metropolitan Life’s and its subsidiaries’ tax returns for the years 1997-1999 and an adjustment of
a benefit of $9 million consisting primarily of a revision in the estimate of income taxes for 2003.
Income from discontinued operations is comprised of the operations and the gain upon disposal from the sale of MetLife Indonesia on Septem-
ber 29, 2005 and SSRM on January 31, 2005, as well as net investment income and net investment gains related to real estate properties that the
Company has classified as available-for-sale or has sold. Income from discontinued operations, net of income taxes, increased by $1,368 million, or
661%, to $1,575 million for the year ended December 31, 2005 from $207 million for the comparable 2004 period. This increase is primarily due to a
gain of $1,193 million, net of income taxes, on the sales of the One Madison Avenue and 200 Park Avenue properties in Manhattan, New York, and the
gains on the sales of SSRM and MetLife Indonesia of $177 million and $10 million, respectively, both net of income taxes, in the year ended
December 31, 2005. Partially offsetting this increase is the gain on the sale of the Sears Tower property of $85 million, net of income taxes, in the year
ended December 31, 2004.
During the year ended December 31, 2004, the Company recorded an $86 million charge, net of income taxes, for a cumulative effect of a change
in accounting principle in accordance with SOP 03-1, which provides guidance on (i) the classification and valuation of long-duration contract liabilities;
(ii) the accounting for sales inducements; and (iii) separate account presentation and valuation. This charge is primarily related to those long-duration
contract liabilities where the amount of the liability is indexed to the performance of a target portfolio of investment securities.
In addition, during the second half of the year ended December 31, 2005, the Company paid $63 million in dividends on its Series A and Series B
preferred shares issued in connection with financing the acquisition of Travelers.
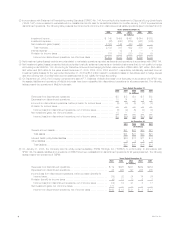
Year ended December 31, 2004 compared with the year ended December 31, 2003 — The Company
Income from continuing operations increased by $808 million, or 44%, to $2,637 million for the year ended December 31, 2004 from $1,829 million
in the comparable 2003 period. Income from continuing operations for the years ended December 31, 2004 and 2003 includes the impact of certain
transactions or events, the timing, nature and amount of which are generally unpredictable. These transactions are described in each applicable
segment’s discussion below. These items contributed a benefit of $113 million, net of income taxes, to the year ended December 31, 2004 and a benefit
of $159 million, net of income taxes, to the comparable 2003 period. Excluding the impact of these items, income from continuing operations increased
by $854 million for the year ended December 31, 2004 compared to the prior 2003 period. This increase is primarily the result of an improvement in net
investment gains (losses), net of income taxes, of $461 million. Also contributing to the increase is higher earnings from interest rate spreads of
approximately $306 million, net of income taxes, in the Institutional and Individual segments. Additionally, the Individual segment contributed $186 million,
net of income taxes, as a result of increased income from policy fees on investment-type products partially offset by higher amortization associated with
DAC of $72 million, net of income taxes, and a reduction in earnings of $101 million, net of income taxes, resulting from an increase in the closed block
policyholder dividend obligation. In addition, the Auto & Home segment’s earnings increased primarily due to an improved non-catastrophe combined
ratio and favorable claim development related to prior accident years of $113 million, net of income taxes. This increase was partially offset by higher
catastrophe losses of $73 million, net of income taxes, in 2004.
Premiums, fees and other revenues increased by $1,996 million, or 8%, to $26,265 million for the year ended December 31, 2004 from
$24,269 million for the comparable 2003 period. The Institutional segment contributed 53% to the year over year increase. This increase stems largely
from sales growth and the acquisitions of new businesses in the group life and the non-medical health & other businesses, as well as an increase in
structured settlements sales and pension close outs. The Reinsurance segment contributed approximately 36% to the Company’s year over year
increase in premiums, fees and other revenues. This growth is primarily attributable to this segment’s coinsurance agreement with Allianz Life and
continued growth in its traditional life reinsurance operations. The Individual segment contributed 6% to the year over year increase primarily due to higher
fee income, partially offset by a reduction in the Company’s closed block premiums as the business continues to run-off.
Interest rate spreads, which generally represent the margin between net investment income and interest credited to policyholder account balances,
increased across the Institutional and Individual segments during the year ended December 31, 2004 compared to the prior year period. Earnings from
interest rate spreads are influenced by several factors, including business growth, movement in interest rates, and certain investment and investment-
related transactions, such as corporate joint venture income and bond and commercial mortgage prepayment fees for which the timing and amount are
generally unpredictable and, as a result, can fluctuate from period to period.
Underwriting results in the Institutional and Individual segments in the year ended December 31, 2004 were less favorable compared to the 2003
period. Underwriting results are significantly influenced by mortality and morbidity trends, claim experience and the reinsurance activity related to certain
blocks of business, and, as a result, can fluctuate from period to period. Underwriting results in the Auto & Home segment were favorable in 2004 as the
combined ratio declined to 90.4%, excluding catastrophes, from 97.1% in the prior year period. This result is largely due to continued improvement in
both auto and homeowner claim frequencies, lower auto severities and an increase in average earned premiums.
Other expenses increased by $645 million, or 9%, to $7,813 million for the year ended December 31, 2004 from $7,168 million for the comparable
2003 period. The 2004 period reflects a $49 million reduction of a premium tax liability and a $22 million reduction of a liability for interest associated with
the resolution of all issues relating to the Internal Revenue Service’s audit of Metropolitan Life’s and its subsidiaries’ tax returns for the years 1997-1999.
These decreases were partially offset by a $50 million contribution of appreciated stock to the MetLife Foundation. The 2003 period includes the impact
of a $144 million reduction of a previously established liability related to the Company’s race-conscious underwriting settlement. In addition, the 2003
period includes a $48 million charge related to certain improperly deferred expenses at New England Financial and a $45 million charge related to VOBA
associated with a change in methodology in determining the liability for future policy benefits in the Company’s International segment. Excluding the
impact of these transactions, other expenses increased by $615 million, or 9%, from the comparable 2003 period. The Reinsurance segment
contributed 31% to this year over year variance primarily due to the growth in expenses associated with the Allianz Life acquisition and continued revenue
growth, as mentioned above. In addition, 27% of this variance is primarily attributable to increases in direct business support expenses and non-
deferrable commission expenses associated with general business growth, as well as infrastructure improvements, partially offset by costs in 2003
associated with office consolidations and an impairment of assets in the Institutional segment. The Individual segment contributed 23% to this increase
MetLife, Inc. 13