MetLife 2005 Annual Report Download - page 87
Download and view the complete annual report
Please find page 87 of the 2005 MetLife annual report below. You can navigate through the pages in the report by either clicking on the pages listed below, or by using the keyword search tool below to find specific information within the annual report.-
 1
1 -
2
-
3
-
4
-
5
-
6
-
7
-
8
-
9
-
10
-
11
-
12
-
13
-
14
-
15
-
16
-
17
-
18
-
19
-
20
-
21
-
22
-
23
-
24
-
25
-
26
-
27
-
28
-
29
-
30
-
31
-
32
-
33
-
34
-
35
-
36
-
37
-
38
-
39
-
40
-
41
-
42
-
43
-
44
-
45
-
46
-
47
-
48
-
49
-
50
-
51
-
52
-
53
-
54
-
55
-
56
-
57
-
58
-
59
-
60
-
61
-
62
-
63
-
64
-
65
-
66
-
67
-
68
-
69
-
70
-
71
-
72
-
73
-
74
-
75
-
76
-
 77
77 -
 78
78 -
 79
79 -
 80
80 -
 81
81 -
 82
82 -
 83
83 -
 84
84 -
 85
85 -
 86
86 -
 87
87 -
 88
88 -
 89
89 -
 90
90 -
 91
91 -
 92
92 -
 93
93 -
 94
94 -
 95
95 -
 96
96 -
 97
97 -
98
-
99
-
100
-
101
-
102
-
103
-
104
-
105
-
106
-
107
-
108
-
109
-
110
-
111
-
112
-
113
-
114
-
115
-
116
-
117
-
118
-
119
-
120
-
121
-
122
-
123
-
124
-
125
-
126
-
127
-
128
-
129
-
130
-
131
-
132
-
133
 |
 |

METLIFE, INC.
NOTES TO CONSOLIDATED FINANCIAL STATEMENTS — (Continued)
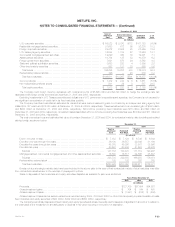
Aging of Gross Unrealized Losses for Fixed Maturities and Equity Securities Available-for-Sale
The following tables present the cost or amortized cost, gross unrealized losses and number of securities for fixed maturities and equity securities at
December 31, 2005 and December 31, 2004, where the estimated fair value had declined and remained below cost or amortized cost by less than
20%, or 20% or more for:
December 31, 2005
Cost or Amortized Gross Unrealized Number of
Cost Losses Securities
Less than 20% or Less than 20% or Less than 20% or
20% more 20% more 20% more
(In millions, except number of securities)
Less than six months ******************************************** $ 92,512 $213 $1,707 $51 11,441 308
Six months or greater but less than nine months********************** 3,704 5 108 2 456 7
Nine months or greater but less than twelve months ****************** 5,006 — 133 — 573 2
Twelve months or greater ***************************************** 7,555 23 240 5 924 8
Total********************************************************* $108,777 $241 $2,188 $58 13,394 325
December 31, 2004
Cost or Amortized Gross Unrealized Number of
Cost Losses Securities
Less than 20% or Less than 20% or Less than 20% or
20% more 20% more 20% more
(In millions, except number of securities)
Less than six months********************************************** $27,175 $ 79 $246 $18 3,186 117
Six months or greater but less than nine months*********************** 8,477 9 111 2 687 5
Nine months or greater but less than twelve months******************** 1,595 19 33 4 206 5
Twelve months or greater ****************************************** 2,798 19 80 15 395 7
Total ********************************************************** $40,045 $126 $470 $39 4,474 134
As of December 31, 2005, $2,188 million of unrealized losses related to securities with an unrealized loss position less than 20% of cost or
amortized cost, which represented 2% of the cost or amortized cost of such securities. As of December 31, 2004, $470 million of unrealized losses
related to securities with an unrealized loss position less than 20% of cost or amortized cost, which represented 1% of the cost or amortized cost of such
securities.
As of December 31, 2005, $58 million of unrealized losses related to securities with an unrealized loss position greater than 20% of cost or
amortized cost, which represented 24% of the cost or amortized cost of such securities. Of such unrealized losses of $58 million, $51 million have been
in an unrealized loss position for a period of less than six months. As of December 31, 2004, $39 million of unrealized losses related to securities with an
unrealized loss position greater than 20% of cost or amortized cost, which represented 31% of the cost or amortized cost of such securities. Of such
unrealized losses of $39 million, $18 million have been in an unrealized loss position for a period of less than six months.
As described more fully in Note 1, the Company performs a regular evaluation, on a security-by-security basis, of its investment holdings in
accordance with its impairment policy in order to evaluate whether such securities are other-than-temporarily impaired. The increase in the unrealized
losses during 2005 is principally driven by an increase in interest rates during the year. Based upon the Company’s evaluation of the securities in
accordance with its impairment policy, the cause of the decline being principally attributable to the general rise in rates during the year, and the
Company’s intent and ability to hold the fixed income and equity securities with unrealized losses for a period of time sufficient for them to recover; the
Company has concluded that the aforementioned securities are not other-than-temporarily impaired.
Securities Lending Program
The Company participates in a securities lending program whereby blocks of securities, which are included in fixed maturity securities, are loaned to
third parties, primarily major brokerage firms. The Company requires a minimum of 102% of the fair value of the loaned securities to be separately
maintained as collateral for the loans. Securities with a cost or amortized cost of $32,068 million and $26,564 million and an estimated fair value of
$32,954 million and $27,974 million were on loan under the program at December 31, 2005 and 2004, respectively. Securities loaned under such
transactions may be sold or repledged by the transferee. The Company was liable for cash collateral under its control of $33,893 million and
$28,678 million at December 31, 2005 and 2004, respectively. Securities loaned transactions are accounted for as financing arrangements on the
Company’s consolidated balance sheets and consolidated statements of cash flows and the income and expenses associated with the program are
reported in net investment income as investment income and investment expenses, respectively. Security collateral of $207 million and $17 million,
respectively, at December 31, 2005 and 2004 on deposit from customers in connection with the securities lending transactions may not be sold or
repledged and is not reflected in the consolidated financial statements.
Assets on Deposit and Held in Trust
The Company had investment assets on deposit with regulatory agencies with a fair market value of $1,597 million and $1,390 million at
December 31, 2005 and 2004, respectively, consisting primarily of fixed maturity securities. Company securities held in trust to satisfy collateral
requirements had an amortized cost of $1,863 million and $2,473 million at December 31, 2005 and 2004, respectively, consisting primarily of fixed
maturity and equity securities.
MetLife, Inc. F-25