MetLife 2005 Annual Report Download - page 41
Download and view the complete annual report
Please find page 41 of the 2005 MetLife annual report below. You can navigate through the pages in the report by either clicking on the pages listed below, or by using the keyword search tool below to find specific information within the annual report.-
 1
1 -
2
-
3
-
4
-
5
-
6
-
7
-
8
-
9
-
10
-
11
-
12
-
13
-
14
-
15
-
16
-
17
-
18
-
19
-
20
-
21
-
22
-
23
-
24
-
25
-
26
-
27
-
28
-
29
-
30
-
 31
31 -
 32
32 -
 33
33 -
 34
34 -
 35
35 -
 36
36 -
 37
37 -
 38
38 -
 39
39 -
 40
40 -
 41
41 -
 42
42 -
 43
43 -
 44
44 -
 45
45 -
 46
46 -
 47
47 -
 48
48 -
 49
49 -
 50
50 -
 51
51 -
52
-
53
-
54
-
55
-
56
-
57
-
58
-
59
-
60
-
61
-
62
-
63
-
64
-
65
-
66
-
67
-
68
-
69
-
70
-
71
-
72
-
73
-
74
-
75
-
76
-
77
-
78
-
79
-
80
-
81
-
82
-
83
-
84
-
85
-
86
-
87
-
88
-
89
-
90
-
91
-
92
-
93
-
94
-
95
-
96
-
97
-
98
-
99
-
100
-
101
-
102
-
103
-
104
-
105
-
106
-
107
-
108
-
109
-
110
-
111
-
112
-
113
-
114
-
115
-
116
-
117
-
118
-
119
-
120
-
121
-
122
-
123
-
124
-
125
-
126
-
127
-
128
-
129
-
130
-
131
-
132
-
133
 |
 |

the pension plan in 2005, 2004 and 2003. Due to anticipated changes in asset allocations, the expected rate of return will be lowered to 8.25% for
purposes of determining 2006 net periodic pension benefit cost.
Based on the December 31, 2005 asset balances, a 25 basis point increase (decrease) in the expected rate of return on plan assets would result in
a decrease (increase) in net periodic benefit cost of approximately $14 million for the pension plans.
Postretirement Benefit Cost
The net periodic postretirement benefit cost benefit consists of the following:
1) Service Cost — Service cost is the increase in the projected postretirement benefit obligation resulting from benefits payable to employees of the
Subsidiaries on service rendered during the current year.
2) Interest Cost on the Liability — Interest cost is the time value adjustment on the projected postretirement benefit obligation at the end of each
year.
3) Expected Return on Plan Assets — Expected return on plan assets is the assumed return earned by the accumulated postretirement fund assets
in a particular year.
4) Amortization of Unrecognized Prior Service Cost — This cost relates to the increase or decrease to postretirement benefit cost for service
provided in prior years due to amendments in plans or initiation of new plans. As the economic benefits of these costs are realized in the future
periods these costs are amortized to postretirement benefit expense over the expected service years of the employees.
5) Amortization of Actuarial Loss — The amortization of actuarial loss comprises of differences between the actual experience and the expected
experience on postretirement benefit plan assets or expected postretirement plan benefit obligation at the end of each year and the amortization
of the unrecognized net gain or loss from prior periods.
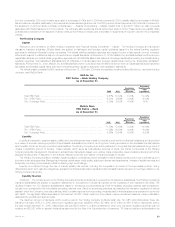
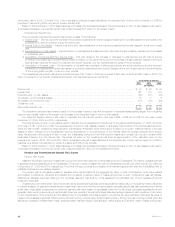
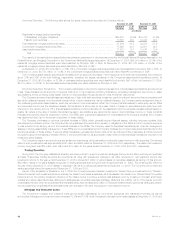
The Subsidiaries recognized postretirement benefit expense of $77 million in 2005 as compared to $62 million in 2004 and $81 million in 2003. The
major components of net periodic postretirement benefit cost described above are as follows:
Postretirement Benefits
2005 2004 2003
(In millions)
Service cost ****************************************************************************************** $37 $32 $39
Interest cost ****************************************************************************************** 121 119 123
Expected return on plan assets ************************************************************************** (79) (77) (72)
Amortization of prior actuarial losses ********************************************************************** 15 7 8
Amortization of prior service cost ************************************************************************* (17) (19) (20)
Curtailment cost *************************************************************************************** —— 3
Net periodic benefit cost ******************************************************************************** $77 $62 $81
The increase in expense was primarily a result of both increase in service cost and amortization of actuarial losses resulting largely from a declining
discount rate, partially offset by the impact of an increase in the expected rates of return on plan assets.
The weighted average discount rate used to calculate the net periodic pension cost was 5.98%, 6.20% and 6.82% for the years ended
December 31, 2005, 2004 and 2003, respectively.
The expected rate of return on plan assets used to calculate the net postretirement benefit cost for the years ended December 31, 2005, 2004 and
2003 was 7.51%, 7.91% and 7.79%. The expected rate of return on plan assets is based on anticipated performance of the various asset sectors in
which the plan invests, weighted by target allocation percentages. Anticipated future performance is based on long-term historical returns of the plan
assets by sector, adjusted for the Subsidiaries’ long-term expectations on the performance of the markets. While the precise expected return derived
using this approach will fluctuate from year to year, the Subsidiaries’ policy is to hold this long-term assumption constant as long as it remains within
reasonable tolerance from the derived rate. The actual net return on the investments has been an approximation of the estimated return for the
postretirement plans in 2005, 2004 and 2003. Due to anticipated changes in asset allocations, the expected rate of return will be lowered to 8.25% for
healthcare benefits and is estimated to remain the same at 6.25% for life benefits.
Based on the December 31, 2005 asset balances, a 25 basis point increase (decrease) in the expected rate of return on plan assets would result in
a decrease (increase) in net periodic benefit cost of approximately $3 million for the postretirement plans.
Pension and Postretirement Benefit Plan Assets
Pension Plan Assets
Assets of the pension plans are invested within group annuity and life insurance contracts issued by the Subsidiaries. The majority of assets are held
in separate accounts established by the Subsidiaries. The account values of assets held with the Subsidiaries were $5,432 million and $5,324 million as
of December 31, 2005 and 2004, respectively. The terms of these contracts are consistent in all material respects with what the Subsidiaries offer to
unaffiliated parties who are similarly situated.
The pension plan’s net assets invested in separate accounts are stated at the aggregate fair value of units of participation. Such value reflects
accumulated contributions, dividends and realized and unrealized investment gains or losses apportioned to such contributions, less withdrawals,
distributions, allocable expenses relating to the purchase, sale and maintenance of the assets and an allocable part of such separate accounts’
investment expenses.
Separate account investments in fixed income and equity securities are generally carried at published market value, or if published market values are
not readily available, at estimated market values. Investments in short-term fixed income securities are generally reflected as cash equivalents and carried
at fair value. Real estate investments are carried at estimated fair value based on appraisals performed by third-party real estate appraisal firms, and
generally, determined by discounting projected cash flows over periods of time and at interest rates deemed appropriate for each investment. Information
on the physical value of the property and the sales prices of comparable properties is used to corroborate fair value estimates. Estimated fair value of
hedge fund net assets is generally determined by third-party pricing vendors using quoted market prices or through the use of pricing models which are
affected by changes in interest rates, foreign exchange rates, financial indices, credit spreads, market supply and demand, market volatility and liquidity.
MetLife, Inc.
38