MetLife 2005 Annual Report Download - page 7
Download and view the complete annual report
Please find page 7 of the 2005 MetLife annual report below. You can navigate through the pages in the report by either clicking on the pages listed below, or by using the keyword search tool below to find specific information within the annual report.-
 1
1 -
 2
2 -
 3
3 -
 4
4 -
 5
5 -
 6
6 -
 7
7 -
 8
8 -
 9
9 -
 10
10 -
 11
11 -
 12
12 -
 13
13 -
 14
14 -
 15
15 -
 16
16 -
 17
17 -
 18
18 -
19
-
20
-
21
-
22
-
23
-
24
-
25
-
26
-
27
-
28
-
29
-
30
-
31
-
32
-
33
-
34
-
35
-
36
-
37
-
38
-
39
-
40
-
41
-
42
-
43
-
44
-
45
-
46
-
47
-
48
-
49
-
50
-
51
-
52
-
53
-
54
-
55
-
56
-
57
-
58
-
59
-
60
-
61
-
62
-
63
-
64
-
65
-
66
-
67
-
68
-
69
-
70
-
71
-
72
-
73
-
74
-
75
-
76
-
77
-
78
-
79
-
80
-
81
-
82
-
83
-
84
-
85
-
86
-
87
-
88
-
89
-
90
-
91
-
92
-
93
-
94
-
95
-
96
-
97
-
98
-
99
-
100
-
101
-
102
-
103
-
104
-
105
-
106
-
107
-
108
-
109
-
110
-
111
-
112
-
113
-
114
-
115
-
116
-
117
-
118
-
119
-
120
-
121
-
122
-
123
-
124
-
125
-
126
-
127
-
128
-
129
-
130
-
131
-
132
-
133
 |
 |

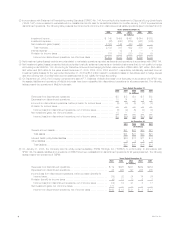
(2) In accordance with Statement of Financial Accounting Standards (‘‘SFAS’’) No. 144, Accounting for the Impairment or Disposal of Long-Lived Assets
(‘‘SFAS 144’’), income related to real estate sold or classified as held-for-sale for transactions initiated on or after January 1, 2002 is presented as
discontinued operations. The following table presents the components of income from discontinued real estate operations (see footnotes 5 and 6):
Years Ended December 31,
2005 2004 2003 2002 2001
(In millions)
Investment income ********************************************** $ 140 $ 409 $ 491 $ 644 $ 583
Investment expense ********************************************* (82) (240) (279) (351) (338)
Net investment gains (losses) ************************************* 2,125 146 420 585 —
Total revenues************************************************ 2,183 315 632 878 245
Interest expense ************************************************ —13 4— 1
Provision for income taxes *************************************** 776 105 230 319 89
Income from discontinued operations, net of income taxes ********** $1,407 $ 197 $ 398 $ 559 $ 155
(3) Net investment gains (losses) exclude amounts related to real estate operations reported as discontinued operations in accordance with SFAS 144.
(4) Net investment gains (losses) presented include scheduled periodic settlement payments on derivative instruments that do not qualify for hedge
accounting under SFAS No. 133, Accounting for Derivative Instruments and Hedging Activities, as amended, of $99 million, $51 million, $84 million,
$32 million and $24 million for the years ended December 31, 2005, 2004, 2003, 2002 and 2001, respectively. Additionally, excluded from net
investment gains (losses) for the year ended December 31, 2005 is ($13) million related to revaluation losses on derivatives used to hedge interest
rate and currency risk on policyholder account balances that do not qualify for hedge accounting.
(5) On September 29, 2005, the Company completed the sale of P.T. Sejahtera (‘‘MetLife Indonesia’’) to a third party. In accordance with SFAS 144,
the assets, liabilities and operations of MetLife Indonesia have been reclassified into discontinued operations for all years presented. The following
tables present the operations of MetLife Indonesia:
Years Ended December 31,
2005 2004 2003 2002 2001
(In millions)
Revenues from discontinued operations ************************************* $5 $5 $4 $5 $3
Expenses from discontinued operations************************************** 10 14 9 8 6
Income from discontinued operations, before provision for income taxes ********** (5) (9) (5) (3) (3)
Provision for income taxes************************************************* —————
Income (loss) from discontinued operations, net of income taxes*************** (5) (9) (5) (3) (3)
Net investment gains, net of income taxes *********************************** 10————
Income (loss) from discontinued operations, net of income taxes*************** $ 5 $(9) $(5) $(3) $(3)
At December 31,
2004 2003 2002 2001
(In millions)
General account assets ********************************************************** $31 $27 $23 $21
Total assets ****************************************************************** $31 $27 $23 $21
Life and health policyholder liabilities ************************************************ $24 $17 $11 $ 8
Other liabilities ****************************************************************** 4355
Total liabilities ***************************************************************** $28 $20 $16 $13
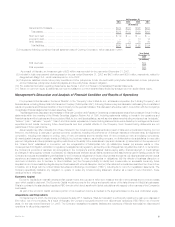
(6) On January 31, 2005, the Company sold its wholly-owned subsidiary, SSRM Holdings, Inc. (‘‘SSRM’’), to a third party. In accordance with
SFAS 144, the assets, liabilities and operations of SSRM have been reclassified into discontinued operations for all years presented. The following
tables present the operations of SSRM:
Years Ended December 31,
2005 2004 2003 2002 2001
(In millions)
Revenues from discontinued operations ******************************** $ 19 $328 $231 $239 $254
Expenses from discontinued operations ******************************** 38 296 197 225 230
Income (loss) from discontinued operations, before provision (benefit) for
income taxes **************************************************** (19)32341424
Provision (benefit) for income taxes ************************************ (5) 13 13 6 7
Income (loss) from discontinued operations, net of income taxes ********* (14) 19 21 8 17
Net investment gains, net of income taxes****************************** 177————
Income from discontinued operations, net of income taxes ************** $163 $ 19 $ 21 $ 8 $ 17
MetLife, Inc.
4