MetLife 2005 Annual Report Download - page 127
Download and view the complete annual report
Please find page 127 of the 2005 MetLife annual report below. You can navigate through the pages in the report by either clicking on the pages listed below, or by using the keyword search tool below to find specific information within the annual report.-
 1
1 -
2
-
3
-
4
-
5
-
6
-
7
-
8
-
9
-
10
-
11
-
12
-
13
-
14
-
15
-
16
-
17
-
18
-
19
-
20
-
21
-
22
-
23
-
24
-
25
-
26
-
27
-
28
-
29
-
30
-
31
-
32
-
33
-
34
-
35
-
36
-
37
-
38
-
39
-
40
-
41
-
42
-
43
-
44
-
45
-
46
-
47
-
48
-
49
-
50
-
51
-
52
-
53
-
54
-
55
-
56
-
57
-
58
-
59
-
60
-
61
-
62
-
63
-
64
-
65
-
66
-
67
-
68
-
69
-
70
-
71
-
72
-
73
-
74
-
75
-
76
-
77
-
78
-
79
-
80
-
81
-
82
-
83
-
84
-
85
-
86
-
87
-
88
-
89
-
90
-
91
-
92
-
93
-
94
-
95
-
96
-
97
-
98
-
99
-
100
-
101
-
102
-
103
-
104
-
105
-
106
-
107
-
108
-
109
-
110
-
111
-
112
-
113
-
114
-
115
-
116
-
 117
117 -
 118
118 -
 119
119 -
 120
120 -
 121
121 -
 122
122 -
 123
123 -
 124
124 -
 125
125 -
 126
126 -
 127
127 -
 128
128 -
 129
129 -
 130
130 -
 131
131 -
 132
132 -
 133
133
 |
 |

METLIFE, INC.
NOTES TO CONSOLIDATED FINANCIAL STATEMENTS — (Continued)
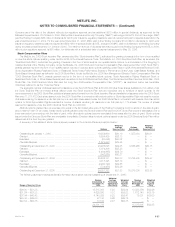
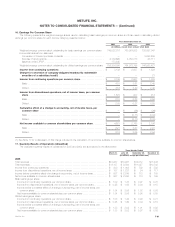
The following table shows the discontinued real estate operations by segment:
Years Ended December 31,
2005 2004 2003
(In millions)
Net investment income
Institutional *********************************************************************************** $ 11 $ 21 $ 31
Individual ************************************************************************************* 17 26 39
Corporate & Other ***************************************************************************** 30 122 142
Total net investment income ******************************************************************* $ 58 $169 $212
Net investment gains (losses)
Institutional *********************************************************************************** $ 242 $ 9 $ 45
Individual ************************************************************************************* 443 3 43
Corporate & Other ***************************************************************************** 1,440 134 332
Total net investment gains (losses)************************************************************** $2,125 $146 $420
Interest Expense
Individual ************************************************************************************* $—$—$1
Corporate & Other ***************************************************************************** —13 3
Total interest expense ************************************************************************ $—$13$4
In the second quarter of 2005, the Company sold its One Madison Avenue and 200 Park Avenue properties in Manhattan, New York for $918 million
and $1.72 billion, respectively, resulting in gains, net of income taxes, of $431 million and $762 million, respectively. The gains are included in income
from discontinued operations in the accompanying consolidated statements of income. In connection with the sale of the 200 Park Avenue property, the
Company has retained rights to existing signage and is leasing space for associates in the property for 20 years with optional renewal periods through
2205.
In 2004, the Company sold one of its real estate investments, Sears Tower, resulting in a realized gain of $85 million, net of income taxes.
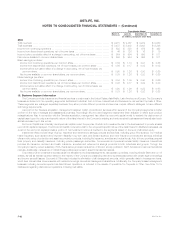
Operations
On September 29, 2005, the Company completed the sale of MetLife Indonesia to a third party resulting in a gain upon disposal of $10 million, net
of income taxes. As a result of this sale, the Company recognized income from discontinued operations of $5 million, net of income taxes, for the year
ended December 31, 2005. The Company reclassified the assets, liabilities and operations of MetLife Indonesia into discontinued operations for all
periods presented.
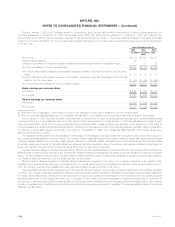
The following tables present the amounts related to the operations and financial position of MetLife Indonesia that has been combined with the
discontinued real estate operations in the consolidated income statements:
Years Ended
December 31,
2005 2004 2003
(In millions)
Revenues from discontinued operations ****************************************************************** $5 $5 $4
Expenses from discontinued operations ****************************************************************** 10 14 9
Income from discontinued operations before provision for income taxes *************************************** (5) (9) (5)
Provision for income taxes ***************************************************************************** ———
Loss from discontinued operations, net of income taxes ************************************************** (5) (9) (5)
Net investment gain, net of income taxes***************************************************************** 10 — —
Income (loss) from discontinued operations, net of income taxes ******************************************* $ 5 $(9) $(5)
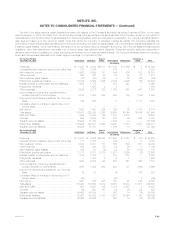
December 31,
2004
(In millions)
Fixed maturities ********************************************************************************************* $17
Short-term investments *************************************************************************************** 1
Cash and cash equivalents *********************************************************************************** 3
Deferred policy acquisition costs ******************************************************************************* 9
Premiums and other receivables ******************************************************************************* 1
Total assets held-for-sale *********************************************************************************** $31
Future policy benefits **************************************************************************************** $5
Policyholder account balances********************************************************************************* 12
Other policyholder funds************************************************************************************** 7
Other liabilities ********************************************************************************************** 4
Total liabilities held-for-sale ********************************************************************************** $28
MetLife, Inc. F-65