MetLife 2005 Annual Report Download - page 54
Download and view the complete annual report
Please find page 54 of the 2005 MetLife annual report below. You can navigate through the pages in the report by either clicking on the pages listed below, or by using the keyword search tool below to find specific information within the annual report.-
 1
1 -
2
-
3
-
4
-
5
-
6
-
7
-
8
-
9
-
10
-
11
-
12
-
13
-
14
-
15
-
16
-
17
-
18
-
19
-
20
-
21
-
22
-
23
-
24
-
25
-
26
-
27
-
28
-
29
-
30
-
31
-
32
-
33
-
34
-
35
-
36
-
37
-
38
-
39
-
40
-
41
-
42
-
43
-
 44
44 -
 45
45 -
 46
46 -
 47
47 -
 48
48 -
 49
49 -
 50
50 -
 51
51 -
 52
52 -
 53
53 -
 54
54 -
 55
55 -
 56
56 -
 57
57 -
 58
58 -
 59
59 -
 60
60 -
 61
61 -
 62
62 -
 63
63 -
 64
64 -
65
-
66
-
67
-
68
-
69
-
70
-
71
-
72
-
73
-
74
-
75
-
76
-
77
-
78
-
79
-
80
-
81
-
82
-
83
-
84
-
85
-
86
-
87
-
88
-
89
-
90
-
91
-
92
-
93
-
94
-
95
-
96
-
97
-
98
-
99
-
100
-
101
-
102
-
103
-
104
-
105
-
106
-
107
-
108
-
109
-
110
-
111
-
112
-
113
-
114
-
115
-
116
-
117
-
118
-
119
-
120
-
121
-
122
-
123
-
124
-
125
-
126
-
127
-
128
-
129
-
130
-
131
-
132
-
133
 |
 |

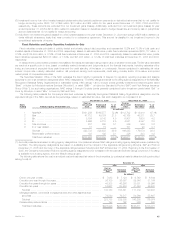
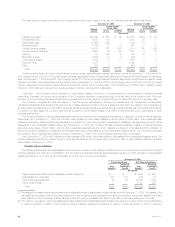
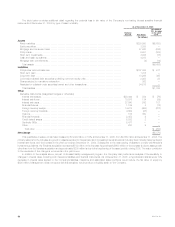
estate joint ventures net of impairments and valuation allowances. The following table presents the carrying value of the Company’s real estate, real estate
joint ventures, real estate held-for-sale and real estate acquired upon foreclosure at:
December 31, 2005 December 31, 2004
Carrying % of Carrying % of
Value Total Value Total
Type
(In millions)
Real estate held-for-investment ******************************************************* $3,735 80.1% $2,687 63.5%
Real estate joint ventures held-for-investment ******************************************* 926 19.8 386 9.1
Foreclosed real estate held-for-investment ********************************************** 4 0.1 3 0.1
4,665 100.0 3,076 72.7
Real estate held-for-sale ************************************************************* — — 1,156 27.3
Foreclosed real estate held-for-sale**************************************************** —— 1—
— — 1,157 27.3
Total real estate, real estate joint ventures and real estate held-for-sale ********************** $4,665 100.0% $4,233 100.0%
The Company’s carrying value of real estate held-for-sale, including real estate acquired upon foreclosure of commercial and agricultural mortgage
loans, in the amounts of $0 million and $1,157 million at December 31, 2005 and 2004, respectively, are net of valuation allowances of $0 million and
$4 million, respectively, and net of impairments of $0 million and $12 million at December 31, 2005 and 2004, respectively.
The Company records real estate acquired upon foreclosure of commercial and agricultural mortgage loans at the lower of estimated fair value or the
carrying value of the mortgage loan at the date of foreclosure.
Certain of the Company’s investments in real estate joint ventures meet the definition of a VIE under FIN 46(r). See ‘‘— Investments — Variable
Interest Entities.’’
In the second quarter of 2005, the Company sold its One Madison Avenue and 200 Park Avenue properties in Manhattan, New York for $918 million
and $1.72 billion, respectively, resulting in gains, net of income taxes, of $431 million and $762 million, respectively. The gains are included in income
from discontinued operations in the accompanying consolidated statements of income. In connection with the sale of the 200 Park Avenue property, the
Company has retained rights to existing signage and is leasing space for associates in the property for 20 years with optional renewal periods through
2205.
In 2004, the Company sold one of its real estate investments, Sears Tower, resulting in a gain of $85 million, net of income taxes.
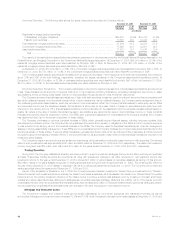
Other Limited Partnership Interests
The carrying value of other limited partnership interests (which primarily represent ownership interests in pooled investment funds that make private
equity investments in companies in the United States and overseas) was $4,276 million and $2,907 million at December 31, 2005 and 2004,
respectively. The Company uses the equity method of accounting for investments in limited partnership interests in which it has more than a minor
interest, has influence over the partnership’s operating and financial policies, does not have a controlling interest and is not the primary beneficiary. The
Company uses the cost method for minor interest investments and when it has virtually no influence over the partnership’s operating and financial
policies. The Company’s investments in other limited partnerships represented 1.4% and 1.2% of cash and invested assets at December 31, 2005 and
2004, respectively.
Some of the Company’s investments in other limited partnership interests meet the definition of a VIE under FIN 46(r). See ‘‘— Investments —
Variable Interest Entities.’’
Other Invested Assets
The Company’s other invested assets consist principally of leveraged leases and funds withheld at interest of $4,573 million and $3,916 million at
December 31, 2005 and 2004, respectively. The leveraged leases are recorded net of non-recourse debt. The Company participates in lease
transactions, which are diversified by industry, asset type and geographic area. The Company regularly reviews residual values and writes down residuals
to expected values as needed. Funds withheld represent amounts contractually withheld by ceding companies in accordance with reinsurance
agreements. For agreements written on a modified coinsurance basis and certain agreements written on a coinsurance basis, assets supporting the
reinsured policies equal to the net statutory reserves are withheld and continue to be legally owned by the ceding company. Other invested assets also
includes derivative revaluation gains and the fair value of embedded derivatives related to funds withheld and modified coinsurance contracts. Interest
accrues to these funds withheld at rates defined by the treaty terms and may be contractually specified or directly related to the investment portfolio. The
Company’s other invested assets represented 2.6% and 2.2% of cash and invested assets at December 31, 2005 and 2004, respectively.
Derivative Financial Instruments
The Company uses a variety of derivatives, including swaps, forwards, futures and option contracts, to manage its various risks. Additionally, the
Company enters into income generation and replication derivative transactions as permitted by its insurance subsidiaries’ Derivatives Use Plans approved
by the applicable state insurance departments.
MetLife, Inc. 51