MetLife 2005 Annual Report Download - page 86
Download and view the complete annual report
Please find page 86 of the 2005 MetLife annual report below. You can navigate through the pages in the report by either clicking on the pages listed below, or by using the keyword search tool below to find specific information within the annual report.-
 1
1 -
2
-
3
-
4
-
5
-
6
-
7
-
8
-
9
-
10
-
11
-
12
-
13
-
14
-
15
-
16
-
17
-
18
-
19
-
20
-
21
-
22
-
23
-
24
-
25
-
26
-
27
-
28
-
29
-
30
-
31
-
32
-
33
-
34
-
35
-
36
-
37
-
38
-
39
-
40
-
41
-
42
-
43
-
44
-
45
-
46
-
47
-
48
-
49
-
50
-
51
-
52
-
53
-
54
-
55
-
56
-
57
-
58
-
59
-
60
-
61
-
62
-
63
-
64
-
65
-
66
-
67
-
68
-
69
-
70
-
71
-
72
-
73
-
74
-
75
-
 76
76 -
 77
77 -
 78
78 -
 79
79 -
 80
80 -
 81
81 -
 82
82 -
 83
83 -
 84
84 -
 85
85 -
 86
86 -
 87
87 -
 88
88 -
 89
89 -
 90
90 -
 91
91 -
 92
92 -
 93
93 -
 94
94 -
 95
95 -
 96
96 -
97
-
98
-
99
-
100
-
101
-
102
-
103
-
104
-
105
-
106
-
107
-
108
-
109
-
110
-
111
-
112
-
113
-
114
-
115
-
116
-
117
-
118
-
119
-
120
-
121
-
122
-
123
-
124
-
125
-
126
-
127
-
128
-
129
-
130
-
131
-
132
-
133
 |
 |

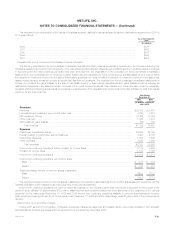
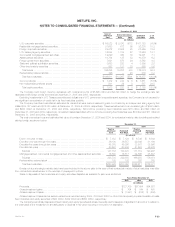
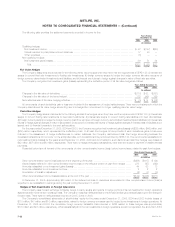
METLIFE, INC.
NOTES TO CONSOLIDATED FINANCIAL STATEMENTS — (Continued)
Unrealized Losses for Fixed Maturities and Equity Securities Available-for-Sale
The following tables show the estimated fair values and gross unrealized losses of the Company’s fixed maturities (aggregated by sector) and equity
securities in an unrealized loss position, aggregated by length of time that the securities have been in a continuous unrealized loss position at
December 31, 2005 and 2004:
December 31, 2005
Equal to or Greater than
Less than 12 Months 12 Months Total
Estimated Gross Estimated Gross Estimated Gross
Fair Unrealized Fair Unrealized Fair Unrealized
Value Loss Value Loss Value Loss
(In millions, except number of securities)
U.S. corporate securities ****************************************** $29,018 $ 737 $2,685 $ 98 $ 31,703 $ 835
Residential mortgage-backed securities ****************************** 31,258 434 1,291 38 32,549 472
Foreign corporate securities**************************************** 13,185 378 1,728 61 14,913 439
U.S. treasury/agency securities************************************* 7,759 85 113 1 7,872 86
Commercial mortgage-backed securities ***************************** 10,190 185 685 22 10,875 207
Asset-backed securities ******************************************* 4,709 42 305 9 5,014 51
Foreign government securities************************************** 1,203 31 327 4 1,530 35
State and political subdivision securities****************************** 1,050 36 16 — 1,066 36
Other fixed maturity securities ************************************** 319 36 52 5 371 41
Total bonds *************************************************** 98,691 1,964 7,202 238 105,893 2,202
Redeemable preferred stocks ************************************** 77 3 — — 77 3
Total fixed maturities ******************************************** $98,768 $1,967 $7,202 $238 $105,970 $2,205
Equity securities ************************************************* $ 671 $ 34 $ 131 $ 7 $ 802 $ 41
Total number of securities in an unrealized loss position **************** 12,787 932 13,719
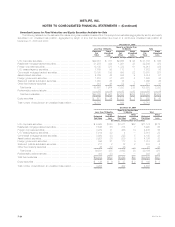
December 31, 2004
Equal to or Greater than
Less than 12 Months 12 Months Total
Gross Gross Gross
Estimated Unrealized Estimated Unrealized Estimated Unrealized
Fair Value Loss Fair Value Loss Fair Value Loss
(In millions, except number of securities)
U.S. corporate securities ******************************************* $ 9,963 $120 $1,211 $52 $11,174 $172
Residential mortgage-backed securities ******************************* 8,545 58 375 7 8,920 65
Foreign corporate securities***************************************** 3,979 71 456 14 4,435 85
U.S. treasury/agency securities ************************************** 5,014 22 4 — 5,018 22
Commercial mortgage-backed securities ****************************** 3,920 33 225 5 4,145 38
Asset-backed securities ******************************************** 3,927 25 209 8 4,136 33
Foreign government securities *************************************** 896 21 117 5 1,013 26
State and political subdivision securities******************************* 211 2 72 2 283 4
Other fixed maturity securities *************************************** 46 33 26 — 72 33
Total bonds **************************************************** 36,501 385 2,695 93 39,196 478
Redeemable preferred stocks *************************************** 303 23 — — 303 23
Total fixed maturities *********************************************** $36,804 $408 $2,695 $93 $39,499 $501
Equity securities ************************************************** $ 136 $ 6 $ 27 $ 2 $ 163 $ 8
Total number of securities in an unrealized loss position ***************** 4,206 402 4,608
MetLife, Inc.
F-24