ICICI Bank 2013 Annual Report Download - page 96
Download and view the complete annual report
Please find page 96 of the 2013 ICICI Bank annual report below. You can navigate through the pages in the report by either clicking on the pages listed below, or by using the keyword search tool below to find specific information within the annual report.-
 1
1 -
2
-
3
-
4
-
5
-
6
-
7
-
8
-
9
-
10
-
11
-
12
-
13
-
14
-
15
-
16
-
17
-
18
-
19
-
20
-
21
-
22
-
23
-
24
-
25
-
26
-
27
-
28
-
29
-
30
-
31
-
32
-
33
-
34
-
35
-
36
-
37
-
38
-
39
-
40
-
41
-
42
-
43
-
44
-
45
-
46
-
47
-
48
-
49
-
50
-
51
-
52
-
53
-
54
-
55
-
56
-
57
-
58
-
59
-
60
-
61
-
62
-
63
-
64
-
65
-
66
-
67
-
68
-
69
-
70
-
71
-
72
-
73
-
74
-
75
-
76
-
77
-
78
-
79
-
80
-
81
-
82
-
83
-
84
-
85
-
 86
86 -
 87
87 -
 88
88 -
 89
89 -
 90
90 -
 91
91 -
 92
92 -
 93
93 -
 94
94 -
 95
95 -
 96
96 -
 97
97 -
 98
98 -
 99
99 -
 100
100 -
 101
101 -
 102
102 -
 103
103 -
 104
104 -
 105
105 -
 106
106 -
107
-
108
-
109
-
110
-
111
-
112
-
113
-
114
-
115
-
116
-
117
-
118
-
119
-
120
-
121
-
122
-
123
-
124
-
125
-
126
-
127
-
128
-
129
-
130
-
131
-
132
-
133
-
134
-
135
-
136
-
137
-
138
-
139
-
140
-
141
-
142
-
143
-
144
-
145
-
146
-
147
-
148
-
149
-
150
-
151
-
152
-
153
-
154
-
155
-
156
-
157
-
158
-
159
-
160
-
161
-
162
-
163
-
164
-
165
-
166
-
167
-
168
-
169
-
170
-
171
-
172
-
173
-
174
-
175
-
176
-
177
-
178
-
179
-
180
-
181
-
182
-
183
-
184
-
185
-
186
-
187
-
188
-
189
-
190
-
191
-
192
-
193
-
194
-
195
-
196
-
197
-
198
-
199
-
200
-
201
-
202
-
203
-
204
-
205
-
206
-
207
-
208
-
209
-
210
-
211
-
212
-
213
-
214
-
215
-
216
-
217
-
218
-
219
-
220
 |
 |

F18
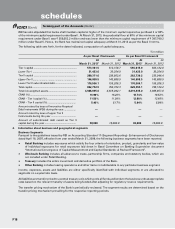
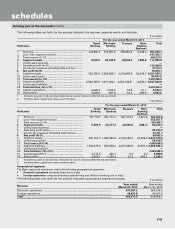
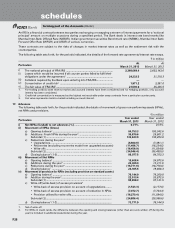
RBI has also stipulated that banks shall maintain capital at higher of the minimum capital required as per Basel II or 80%
of the minimum capital requirement under Basel I. At March 31, 2013, the prudential floor at 80% of the minimum capital
requirement under Basel I was ` 359,052.2 million and was lower than the minimum capital requirement of ` 397,749.2
million under Basel II. Hence, the Bank has maintained capital adequacy at March 31, 2013 as per the Basel II norms.
The following table sets forth, for the dates indicated, computation of capital adequacy.
` in million
As per Basel I framework As per Basel II framework
At
March 31, 20131
At
March 31, 2012
At
March 31, 20131
At
March 31, 2012
Tier I capital .............................................................. 573,361.5 512,158.7 565,615.9 505,182.8
Lower Tier I ............................................................... 31,423.0 30,254.9 31,423.0 30,254.9
Tier II capital .............................................................. 269,371.0 238,563.6 262,739.2 232,946.4
Upper Tier II ............................................................... 146,958.5 143,889.5 146,958.5 143,889.5
Lower Tier II subordinated debt ............................... 176,506.1 155,206.3 176,506.1 155,206.3
Total capital ................................................................ 842,732.5 750,722.3 828,355.1 738,129.2
Total risk weighted assets ......................................... 4,986,835.6 4,618,042.1 4,419,435.0 3,985,857.8
CRAR (%) ................................................................... 16.90% 16.26% 18.74% 18.52%
CRAR – Tier I capital (%) .......................................... 11.50% 11.09% 12.80% 12.68%
CRAR – Tier II capital (%) ......................................... 5.40% 5.17% 5.94% 5.84%
Amount raised by issue of Innovative Perpetual
Debt Instruments (IPDI) during the year .................. ————
Amount raised by issue of upper Tier II
Instruments during the year .................................... ————
Amount of subordinated debt raised as Tier II
capital during the year ............................................. 38,000 16,000.0 38,000 16,000.0
4. Information about business and geographical segments
Business Segments
Pursuant to the guidelines issued by RBI on Accounting Standard 17-(Segment Reporting)- Enhancement of Disclosures
dated April 18, 2007, effective from year ended March 31, 2008, the following business segments have been reported.
•Retail Banking includes exposures which satisfy the four criteria of orientation, product, granularity and low value
of individual exposures for retail exposures laid down in Basel Committee on Banking Supervision document
“International Convergence of Capital Measurement and Capital Standards: A Revised Framework”.
•Wholesale Banking includes all advances to trusts, partnership firms, companies and statutory bodies, which are
not included under Retail Banking.
•Treasury includes the entire investment and derivative portfolio of the Bank.
•Other Banking includes leasing operations and other items not attributable to any particular business segment.
Income, expenses, assets and liabilities are either specifically identified with individual segments or are allocated to
segments on a systematic basis.
All liabilities are transfer priced to a central treasury unit, which pools all funds and lends to the business units at appropriate
rates based on the relevant maturity of assets being funded after adjusting for regulatory reserve requirements.
The transfer pricing mechanism of the Bank is periodically reviewed. The segment results are determined based on the
transfer pricing mechanism prevailing for the respective reporting periods.
forming part of the Accounts (Contd.)
schedules