ICICI Bank 2013 Annual Report Download - page 82
Download and view the complete annual report
Please find page 82 of the 2013 ICICI Bank annual report below. You can navigate through the pages in the report by either clicking on the pages listed below, or by using the keyword search tool below to find specific information within the annual report.-
 1
1 -
2
-
3
-
4
-
5
-
6
-
7
-
8
-
9
-
10
-
11
-
12
-
13
-
14
-
15
-
16
-
17
-
18
-
19
-
20
-
21
-
22
-
23
-
24
-
25
-
26
-
27
-
28
-
29
-
30
-
31
-
32
-
33
-
34
-
35
-
36
-
37
-
38
-
39
-
40
-
41
-
42
-
43
-
44
-
45
-
46
-
47
-
48
-
49
-
50
-
51
-
52
-
53
-
54
-
55
-
56
-
57
-
58
-
59
-
60
-
61
-
62
-
63
-
64
-
65
-
66
-
67
-
68
-
69
-
70
-
71
-
 72
72 -
 73
73 -
 74
74 -
 75
75 -
 76
76 -
 77
77 -
 78
78 -
 79
79 -
 80
80 -
 81
81 -
 82
82 -
 83
83 -
 84
84 -
 85
85 -
 86
86 -
 87
87 -
 88
88 -
 89
89 -
 90
90 -
 91
91 -
 92
92 -
93
-
94
-
95
-
96
-
97
-
98
-
99
-
100
-
101
-
102
-
103
-
104
-
105
-
106
-
107
-
108
-
109
-
110
-
111
-
112
-
113
-
114
-
115
-
116
-
117
-
118
-
119
-
120
-
121
-
122
-
123
-
124
-
125
-
126
-
127
-
128
-
129
-
130
-
131
-
132
-
133
-
134
-
135
-
136
-
137
-
138
-
139
-
140
-
141
-
142
-
143
-
144
-
145
-
146
-
147
-
148
-
149
-
150
-
151
-
152
-
153
-
154
-
155
-
156
-
157
-
158
-
159
-
160
-
161
-
162
-
163
-
164
-
165
-
166
-
167
-
168
-
169
-
170
-
171
-
172
-
173
-
174
-
175
-
176
-
177
-
178
-
179
-
180
-
181
-
182
-
183
-
184
-
185
-
186
-
187
-
188
-
189
-
190
-
191
-
192
-
193
-
194
-
195
-
196
-
197
-
198
-
199
-
200
-
201
-
202
-
203
-
204
-
205
-
206
-
207
-
208
-
209
-
210
-
211
-
212
-
213
-
214
-
215
-
216
-
217
-
218
-
219
-
220
 |
 |

F4
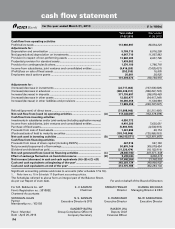
(` in ‘000s)
cash flow statement
Year ended
31.03.2013
Year ended
31.03.2012
Cash flow from operating activities
Profit before taxes ........................................................................................... 113,966,897 88,034,223
Adjustments for :
Depreciation and amortisation ....................................................................... 5,709,115 6,016,209
Net (appreciation)/depreciation on investments ............................................ 4,647,716 11,007,862
Provision in respect of non-performing assets ............................................. 13,948,385 9,931,796
Prudential provision for standard assets ........................................................ 1,439,082 —
Provision for contingencies & others .............................................................. 1,376,106 1,766,718
Income from subsidiaries, joint ventures and consolidated entities ............ (9,416,200) (7,625,631)
(Profit)/loss on sale of fixed assets ................................................................. (352,510) 16,876
Employees stock options grants .................................................................... 20,981 20,925
131,339,572 109,168,978
Adjustments for :
(Increase)/decrease in investments ................................................................ (22,717,062) (127,636,008)
(Increase)/decrease in advances .................................................................... (380,239,011) (388,801,703)
Increase/(decrease) in deposits ...................................................................... 371,136,697 298,978,483
(Increase)/decrease in other assets ................................................................ 12,992,477 (34,417,248)
Increase/(decrease) in other liabilities and provisions .................................. 30,496,358 11,538,969
11,669,459 (240,337,507)
Refund/(payment) of direct taxes ................................................................... (31,988,940) (21,211,450)
Net cash flow from/(used in) operating activities ....................................... (A) 111,020,091 (152,379,979)
Cash flow from investing activities
Investments in subsidiaries and/or joint ventures (including application money) 4,050,772 —
Income from subsidiaries, joint ventures and consolidated entities ............ 9,416,200 7,625,631
Purchase of fixed assets.................................................................................. (5,883,595) (4,530,919)
Proceeds from sale of fixed assets ................................................................. 1,241,898 90,174
(Purchase)/sale of held to maturity securities ................................................ (103,140,846) (125,986,553)
Net cash used in investing activities ............................................................ (B) (94,315,571) (122,801,667)
Cash flow from financing activities
Proceeds from issue of share capital (including ESOPs) ............................... 447,516 591,128
Net proceeds/(repayment) of borrowings ...................................................... 50,676,148 305,079,424
Dividend and dividend tax paid ...................................................................... (21,226,474) (18,152,914)
Net cash generated from/(used in) financing activities .............................. (C) 29,897,190 287,517, 638
Effect of exchange fluctuation on translation reserve ................................ (D) 5,280,344 9,056,310
Net increase/(decrease) in cash and cash equivalents (A)+(B)+(C)+(D) 51,882,054 21,392,302
Cash and cash equivalents at beginning of the year1 .................................. 362,293,134 340,900,832
Cash and cash equivalents at end of the year1 ............................................ 414,175,188 362,293,134
for the year ended March 31, 2013
Significant accounting policies and notes to accounts (refer schedule 17 & 18).
1. Refer item no. 15 in Schedule 17 Significant accounting policies.
The Schedules referred to above form an integral part of the Balance Sheet.
As per our Report of even date. For and on behalf of the Board of Directors
For S.R. Batliboi & Co. LLP
Firm’s Registration no.: 301003E
Chartered Accountants
K. V. KAMATH SRIDAR IYENGAR CHANDA KOCHHAR
Chairman Director Managing Director & CEO
SHRAWAN JALAN
Partner
Membership no.: 102102
N. S. KANNAN K. RAMKUMAR RAJIV SABHARWAL
Executive Director & CFO Executive Director Executive Director
SANDEEP BATRA RAKESH JHA
Place : Mumbai Group Compliance Officer &
Company Secretary
Deputy Chief
Financial Officer
Date : April 26, 2013