ICICI Bank 2013 Annual Report Download - page 65
Download and view the complete annual report
Please find page 65 of the 2013 ICICI Bank annual report below. You can navigate through the pages in the report by either clicking on the pages listed below, or by using the keyword search tool below to find specific information within the annual report.-
 1
1 -
2
-
3
-
4
-
5
-
6
-
7
-
8
-
9
-
10
-
11
-
12
-
13
-
14
-
15
-
16
-
17
-
18
-
19
-
20
-
21
-
22
-
23
-
24
-
25
-
26
-
27
-
28
-
29
-
30
-
31
-
32
-
33
-
34
-
35
-
36
-
37
-
38
-
39
-
40
-
41
-
42
-
43
-
44
-
45
-
46
-
47
-
48
-
49
-
50
-
51
-
52
-
53
-
54
-
 55
55 -
 56
56 -
 57
57 -
 58
58 -
 59
59 -
 60
60 -
 61
61 -
 62
62 -
 63
63 -
 64
64 -
 65
65 -
 66
66 -
 67
67 -
 68
68 -
 69
69 -
 70
70 -
 71
71 -
 72
72 -
 73
73 -
 74
74 -
 75
75 -
76
-
77
-
78
-
79
-
80
-
81
-
82
-
83
-
84
-
85
-
86
-
87
-
88
-
89
-
90
-
91
-
92
-
93
-
94
-
95
-
96
-
97
-
98
-
99
-
100
-
101
-
102
-
103
-
104
-
105
-
106
-
107
-
108
-
109
-
110
-
111
-
112
-
113
-
114
-
115
-
116
-
117
-
118
-
119
-
120
-
121
-
122
-
123
-
124
-
125
-
126
-
127
-
128
-
129
-
130
-
131
-
132
-
133
-
134
-
135
-
136
-
137
-
138
-
139
-
140
-
141
-
142
-
143
-
144
-
145
-
146
-
147
-
148
-
149
-
150
-
151
-
152
-
153
-
154
-
155
-
156
-
157
-
158
-
159
-
160
-
161
-
162
-
163
-
164
-
165
-
166
-
167
-
168
-
169
-
170
-
171
-
172
-
173
-
174
-
175
-
176
-
177
-
178
-
179
-
180
-
181
-
182
-
183
-
184
-
185
-
186
-
187
-
188
-
189
-
190
-
191
-
192
-
193
-
194
-
195
-
196
-
197
-
198
-
199
-
200
-
201
-
202
-
203
-
204
-
205
-
206
-
207
-
208
-
209
-
210
-
211
-
212
-
213
-
214
-
215
-
216
-
217
-
218
-
219
-
220
 |
 |

Annual Report 2012-2013 63
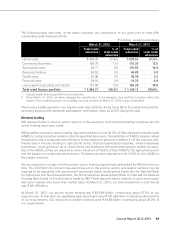
increased by 11.4% from ` 963.63 billion at March 31, 2012 to ` 1,073.59 billion at March 31, 2013. Net
advances of overseas branches (including offshore banking unit) decreased in USD terms by 0.7% from
US$ 13.6 billion at March 31, 2012 to US$ 13.5 billion at March 31, 2013. In rupee terms, net advances of
overseas branches (including offshore banking unit) increased by 5.7% from ` 694.03 billion at March 31,
2012 to ` 733.57 billion at March 31, 2013.
Fixed and other assets
Net fixed assets increased marginally from ` 46.15 billion at March 31, 2012 to ` 46.47 billion at March
31, 2013. Other assets decreased by 16.7% from ` 349.37 billion at March 31, 2012 to ` 290.87 billion at
March 31, 2013.
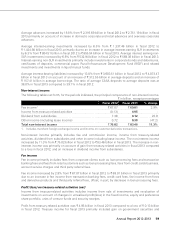
At March 31, 2013, we have presented mark-to-market on forex and derivatives trading transactions
(including revaluation on outstanding funding swaps) and interest accrual on hedge swaps on gross basis.
Accordingly, the gross positive mark-to-market amounting to ` 113.24 billion has been included in Other
assets at March 31, 2013. Consequent to the change, Other assets have increased by ` 154.22 billion at
March 31, 2012. This was previously presented on a net basis and the net positive mark-to-market was
recorded in ‘Other Assets’ and the net negative mark-to-market was recorded in ‘Other Liabilities’.
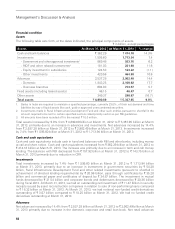
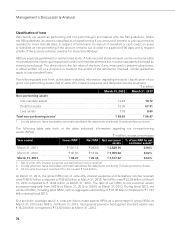
Liabilities
The following table sets forth, at the dates indicated, the principal components of liabilities (including
capital and reserves).
` in billion, except percentages
Liabilities At March 31, 2012 At March 31, 2013 % change
Equity share capital ` 11.53 ` 11.54 0.1%
Reserves 592.52 655.52 10.6
Deposits 2,555.00 2,926.14 14.5
- Savings account deposits 760.46 856.51 12.6
- Current account deposits 349.73 369.26 5.6
- Term deposits 1,444.81 1,700.37 17.7
Borrowings (excluding subordinated debt and
preference share capital) 1,022.00 1,053.29 3.1
- Domestic 377.38 402.98 6.8
- Overseas branches 644.62 650.31 0.9
Subordinated debt (included in Tier-1 and
Tier-2 capital)1376.15 396.62 5.4
- Domestic 358.90 378.21 5.4
- Overseas branches 17.25 18.41 6.7
Preference share capital13.50 3.50 0.0
Other liabilities 329.99 321.34 (2.6)
Total liabilities ` 4,890.69 ` 5,367.95 9.8%
1. Included in Schedule 4 - “Borrowings” of the balance sheet.
2. All amounts have been rounded off to the nearest ` 10.0 million.
Total liabilities (including capital and reserves) increased by 9.8% from ` 4,890.69 billion at March 31, 2012 to
` 5,367.95 billion at March 31, 2013, primarily due to an increase in borrowings and deposits. Deposits
increased by 14.5% from ` 2,555.00 billion at March 31, 2012 to ` 2,926.14 billion at March 31, 2013.
Borrowings increased from ` 1,401.65 billion at March 31, 2012 to ` 1,453.41 billion at March 31, 2013.
Deposits
Deposits increased by 14.5% from ` 2,555.00 billion at March 31, 2012 to ` 2,926.14 billion at March 31,
2013. Term deposits increased from ` 1,444.81 billion at March 31, 2012 to ` 1,700.37 billion at March
31, 2013, while savings deposits increased from ` 760.46 billion at March 31, 2012 to ` 856.51 billion
at March 31, 2013 and current deposits increased from ` 349.73 billion at March 31, 2012 to ` 369.26