ICICI Bank 2013 Annual Report Download - page 74
Download and view the complete annual report
Please find page 74 of the 2013 ICICI Bank annual report below. You can navigate through the pages in the report by either clicking on the pages listed below, or by using the keyword search tool below to find specific information within the annual report.-
 1
1 -
2
-
3
-
4
-
5
-
6
-
7
-
8
-
9
-
10
-
11
-
12
-
13
-
14
-
15
-
16
-
17
-
18
-
19
-
20
-
21
-
22
-
23
-
24
-
25
-
26
-
27
-
28
-
29
-
30
-
31
-
32
-
33
-
34
-
35
-
36
-
37
-
38
-
39
-
40
-
41
-
42
-
43
-
44
-
45
-
46
-
47
-
48
-
49
-
50
-
51
-
52
-
53
-
54
-
55
-
56
-
57
-
58
-
59
-
60
-
61
-
62
-
63
-
 64
64 -
 65
65 -
 66
66 -
 67
67 -
 68
68 -
 69
69 -
 70
70 -
 71
71 -
 72
72 -
 73
73 -
 74
74 -
 75
75 -
 76
76 -
 77
77 -
 78
78 -
 79
79 -
 80
80 -
 81
81 -
 82
82 -
 83
83 -
 84
84 -
85
-
86
-
87
-
88
-
89
-
90
-
91
-
92
-
93
-
94
-
95
-
96
-
97
-
98
-
99
-
100
-
101
-
102
-
103
-
104
-
105
-
106
-
107
-
108
-
109
-
110
-
111
-
112
-
113
-
114
-
115
-
116
-
117
-
118
-
119
-
120
-
121
-
122
-
123
-
124
-
125
-
126
-
127
-
128
-
129
-
130
-
131
-
132
-
133
-
134
-
135
-
136
-
137
-
138
-
139
-
140
-
141
-
142
-
143
-
144
-
145
-
146
-
147
-
148
-
149
-
150
-
151
-
152
-
153
-
154
-
155
-
156
-
157
-
158
-
159
-
160
-
161
-
162
-
163
-
164
-
165
-
166
-
167
-
168
-
169
-
170
-
171
-
172
-
173
-
174
-
175
-
176
-
177
-
178
-
179
-
180
-
181
-
182
-
183
-
184
-
185
-
186
-
187
-
188
-
189
-
190
-
191
-
192
-
193
-
194
-
195
-
196
-
197
-
198
-
199
-
200
-
201
-
202
-
203
-
204
-
205
-
206
-
207
-
208
-
209
-
210
-
211
-
212
-
213
-
214
-
215
-
216
-
217
-
218
-
219
-
220
 |
 |

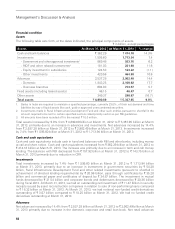
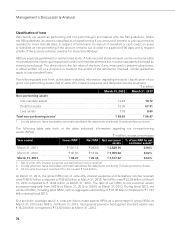
72
restructured as compared to ` 35.95 billion of 28 borrowers during fiscal 2012. Net principal outstanding
of standard restructured borrowers increased from ` 45.54 billion at March 31, 2012 to ` 53.15 billion at
March 31, 2013.
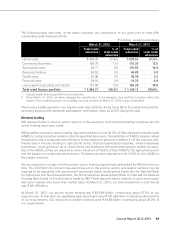
Segment information
RBI in its guidelines on “segmental reporting” has stipulated specified business segments and their
definitions, for the purposes of public disclosures on business information for banks in India.
The standalone segmental report for fiscal 2013, based on the segments identified and defined by RBI,
has been presented as follows:
• Retail Banking includes exposures of the Bank, which satisfy the four qualifying criteria of ‘regulatory
retail portfolio’ as stipulated by the RBI guidelines on the Basel II framework.
• Wholesale Banking includes all advances to trusts, partnership firms, companies and statutory bodies,
by the Bank which are not included in the Retail Banking segment, as per the RBI guidelines for the
Bank.
• Treasury includes the entire investment portfolio of the Bank.
• Other Banking includes leasing operations and other items not attributable to any particular business
segment of the Bank.
Framework for transfer pricing
All liabilities are transfer priced to a central treasury unit, which pools all funds and lends to the business
units at appropriate rates based on the relevant maturity of assets being funded after adjusting for
regulatory reserve requirement and directed lending requirements.
Retail banking segment
The profit before tax of the retail banking segment increased from ` 5.50 billion in fiscal 2012 to ` 9.55
billion in fiscal 2013 primarily due to write-back/lower provisions for loan losses in the retail asset portfolio
and increase in non-interest income offset, in part, by increase in non-interest expenses.
Net interest income increased by 10.3% from ` 38.15 billion in fiscal 2012 to ` 42.09 billion in fiscal 2013
primarily due to increase in average current account and savings account deposits of the retail banking
segment.
Non-interest income increased by 18.1% from ` 25.76 billion in fiscal 2012 to ` 30.42 billion in fiscal 2013,
primarily due to higher level of foreign exchange and transaction banking fees, third party referral fees,
and fees from the credit card portfolio.
Non-interest expenses increased by 11.9% from ` 56.52 billion in fiscal 2012 to ` 63.22 billion in fiscal
2013, primarily due to increase in employee expenses, expansion in branch network offset, in part, by
reduction in collection expenses.
In fiscal 2013, there was write-back of ` 0.24 billion compared to provisions of ` 1.88 billion in fiscal 2012
primarily due to write-back/lower provisions for loan losses in the retail asset portfolio.
Wholesale banking segment
Profit before tax of the wholesale banking segment increased from ` 62.07 billion in fiscal 2012 to
` 66.19 billion in fiscal 2013 primarily due to increase in net interest income offset, in part, by increase in
provisions and decrease in non-interest income.
Management’s Discussion & Analysis