ICICI Bank 2013 Annual Report Download - page 63
Download and view the complete annual report
Please find page 63 of the 2013 ICICI Bank annual report below. You can navigate through the pages in the report by either clicking on the pages listed below, or by using the keyword search tool below to find specific information within the annual report.-
 1
1 -
2
-
3
-
4
-
5
-
6
-
7
-
8
-
9
-
10
-
11
-
12
-
13
-
14
-
15
-
16
-
17
-
18
-
19
-
20
-
21
-
22
-
23
-
24
-
25
-
26
-
27
-
28
-
29
-
30
-
31
-
32
-
33
-
34
-
35
-
36
-
37
-
38
-
39
-
40
-
41
-
42
-
43
-
44
-
45
-
46
-
47
-
48
-
49
-
50
-
51
-
52
-
 53
53 -
 54
54 -
 55
55 -
 56
56 -
 57
57 -
 58
58 -
 59
59 -
 60
60 -
 61
61 -
 62
62 -
 63
63 -
 64
64 -
 65
65 -
 66
66 -
 67
67 -
 68
68 -
 69
69 -
 70
70 -
 71
71 -
 72
72 -
 73
73 -
74
-
75
-
76
-
77
-
78
-
79
-
80
-
81
-
82
-
83
-
84
-
85
-
86
-
87
-
88
-
89
-
90
-
91
-
92
-
93
-
94
-
95
-
96
-
97
-
98
-
99
-
100
-
101
-
102
-
103
-
104
-
105
-
106
-
107
-
108
-
109
-
110
-
111
-
112
-
113
-
114
-
115
-
116
-
117
-
118
-
119
-
120
-
121
-
122
-
123
-
124
-
125
-
126
-
127
-
128
-
129
-
130
-
131
-
132
-
133
-
134
-
135
-
136
-
137
-
138
-
139
-
140
-
141
-
142
-
143
-
144
-
145
-
146
-
147
-
148
-
149
-
150
-
151
-
152
-
153
-
154
-
155
-
156
-
157
-
158
-
159
-
160
-
161
-
162
-
163
-
164
-
165
-
166
-
167
-
168
-
169
-
170
-
171
-
172
-
173
-
174
-
175
-
176
-
177
-
178
-
179
-
180
-
181
-
182
-
183
-
184
-
185
-
186
-
187
-
188
-
189
-
190
-
191
-
192
-
193
-
194
-
195
-
196
-
197
-
198
-
199
-
200
-
201
-
202
-
203
-
204
-
205
-
206
-
207
-
208
-
209
-
210
-
211
-
212
-
213
-
214
-
215
-
216
-
217
-
218
-
219
-
220
 |
 |

Annual Report 2012-2013 61
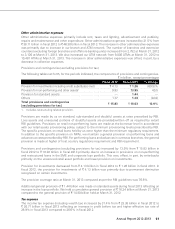
Other administrative expenses
Other administrative expenses primarily include rent, taxes and lighting, advertisement and publicity,
repairs and maintenance and other expenditure. Other administrative expenses increased by 21.5% from
` 38.11 billion in fiscal 2012 to ` 46.30 billion in fiscal 2013. The increase in other administrative expenses
was primarily due to increase in our branch and ATM network. The number of branches and extension
counters (excluding foreign branches and offshore banking units) increased from 2,752 at March 31, 2012
to 3,100 at March 31, 2013. We also increased our ATM network from 9,006 ATMs at March 31, 2012 to
10,481 ATMs at March 31, 2013. The increase in other administrative expenses was offset, in part, by a
decrease in collection expenses.
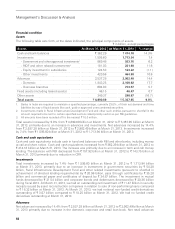
Provisions and contingencies (excluding provisions for tax)
The following tables set forth, for the periods indicated, the components of provisions and contingencies.
` in billion, except percentages
Fiscal 2012 Fiscal 2013 % change
Provision for investments (including credit substitutes) (net) ` 4.13 ` 1.26 (69.5)%
Provision for non-performing and other assets19.93 13.95 40.5
Provision for standard assets — 1.44 —
Others 1.77 1.38 (22.0)
Total provisions and contingencies
(excluding provisions for tax) ` 15.83 ` 18.03 13.9%
1. Includes restructuring related provision.
Provisions are made by us on standard, sub-standard and doubtful assets at rates prescribed by RBI.
Loss assets and unsecured portions of doubtful assets are provided/written off as required by extant
RBI guidelines. Provisions on retail non-performing loans are made at the borrower level in accordance
with our retail assets provisioning policy, subject to the minimum provisioning levels prescribed by RBI.
The specific provisions on retail loans held by us were higher than the minimum regulatory requirement.
In addition to the specific provision on NPAs, we maintain a general provision on performing loans and
advances at rates prescribed by RBI. For performing loans and advances in overseas branches, the general
provision is made at higher of host country regulations requirement and RBI requirement.
Provisions and contingencies (excluding provisions for tax) increased by 13.9% from ` 15.83 billion in
fiscal 2012 to ` 18.03 billion in fiscal 2013 primarily due to an increase in provisions on non-performing
and restructured loans in the SME and corporate loan portfolio. This was, offset, in part, by write-backs
primarily on the unsecured retail asset portfolio and lower provision on investments.
Provision for investments decreased from ` 4.13 billion in fiscal 2012 to ` 1.26 billion in fiscal 2013. In
fiscal 2012, the provision for investments of ` 4.13 billion was primarily due to permanent diminution
recognised on certain investments.
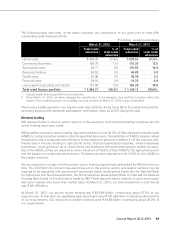
The provision coverage ratio at March 31, 2013 computed as per the RBI guidelines was 76.8%.
Additional general provision of ` 1.44 billion was made on standard assets during fiscal 2013 reflecting an
increase in the loan portfolio. We held a cumulative general provision of ` 16.24 billion at March 31, 2013
compared to the general provision of ` 14.80 billion held at March 31, 2012.
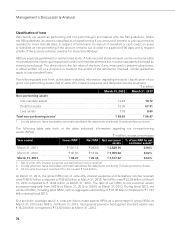
Tax expense
The income tax expense (including wealth tax) increased by 31.4% from ` 23.38 billion in fiscal 2012 to
` 30.71 billion in fiscal 2013 reflecting an increase in profit before tax and higher effective tax rate of
26.9% in fiscal 2013 compared to 26.6% in fiscal 2012.