ICICI Bank 2013 Annual Report Download - page 75
Download and view the complete annual report
Please find page 75 of the 2013 ICICI Bank annual report below. You can navigate through the pages in the report by either clicking on the pages listed below, or by using the keyword search tool below to find specific information within the annual report.-
 1
1 -
2
-
3
-
4
-
5
-
6
-
7
-
8
-
9
-
10
-
11
-
12
-
13
-
14
-
15
-
16
-
17
-
18
-
19
-
20
-
21
-
22
-
23
-
24
-
25
-
26
-
27
-
28
-
29
-
30
-
31
-
32
-
33
-
34
-
35
-
36
-
37
-
38
-
39
-
40
-
41
-
42
-
43
-
44
-
45
-
46
-
47
-
48
-
49
-
50
-
51
-
52
-
53
-
54
-
55
-
56
-
57
-
58
-
59
-
60
-
61
-
62
-
63
-
64
-
 65
65 -
 66
66 -
 67
67 -
 68
68 -
 69
69 -
 70
70 -
 71
71 -
 72
72 -
 73
73 -
 74
74 -
 75
75 -
 76
76 -
 77
77 -
 78
78 -
 79
79 -
 80
80 -
 81
81 -
 82
82 -
 83
83 -
 84
84 -
 85
85 -
86
-
87
-
88
-
89
-
90
-
91
-
92
-
93
-
94
-
95
-
96
-
97
-
98
-
99
-
100
-
101
-
102
-
103
-
104
-
105
-
106
-
107
-
108
-
109
-
110
-
111
-
112
-
113
-
114
-
115
-
116
-
117
-
118
-
119
-
120
-
121
-
122
-
123
-
124
-
125
-
126
-
127
-
128
-
129
-
130
-
131
-
132
-
133
-
134
-
135
-
136
-
137
-
138
-
139
-
140
-
141
-
142
-
143
-
144
-
145
-
146
-
147
-
148
-
149
-
150
-
151
-
152
-
153
-
154
-
155
-
156
-
157
-
158
-
159
-
160
-
161
-
162
-
163
-
164
-
165
-
166
-
167
-
168
-
169
-
170
-
171
-
172
-
173
-
174
-
175
-
176
-
177
-
178
-
179
-
180
-
181
-
182
-
183
-
184
-
185
-
186
-
187
-
188
-
189
-
190
-
191
-
192
-
193
-
194
-
195
-
196
-
197
-
198
-
199
-
200
-
201
-
202
-
203
-
204
-
205
-
206
-
207
-
208
-
209
-
210
-
211
-
212
-
213
-
214
-
215
-
216
-
217
-
218
-
219
-
220
 |
 |

Annual Report 2012-2013 73
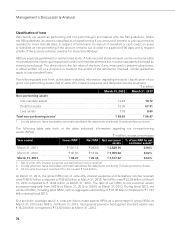
Net interest income increased by 38.7% from ` 49.37 billion in fiscal 2012 to ` 68.46 billion in fiscal 2013
primarily driven by loan growth in the wholesale banking segment. Non-interest income decreased by
6.8% from ` 41.01 billion in fiscal 2012 to ` 38.22 billion in fiscal 2013, primarily due to moderation in
lending linked fee income offset, in part, by increase in foreign exchange and transaction banking related
fees from corporate clients. Provisions were higher primarily due to higher non-performing loans and the
impact of restructuring of loans during the year.
Treasury segment
Profit before tax of the treasury segment increased from ` 20.81 billion in fiscal 2012 to ` 36.54 billion
in fiscal 2013 primarily due to increase in non-interest income offset, in part, by increase in non-interest
expenses. The non-interest income was higher primarily due to higher level of dividend income from
subsidiaries, realised gain on government securities portfolio and other fixed income positions and
foreign exchange trading gains.
Other banking segment
Profit before tax of other banking segment in fiscal 2013 was ` 1.69 billion compared to a loss of ` 0.35
billion in fiscal 2012 primarily due to higher interest on income-tax refunds.
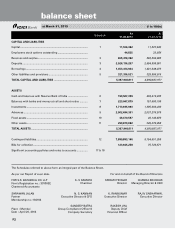
CONSOLIDATED FINANCIALS AS PER INDIAN GAAP
The consolidated profit after tax including the results of operations of our subsidiaries and other
consolidating entities increased by 25.7% from ` 76.43 billion in fiscal 2012 to ` 96.04 billion in fiscal
2013 primarily due to increase in the profit of ICICI Bank and profit of ICICI Lombard General Insurance
Company Limited (ICICI General). In fiscal 2012, ICICI General had a loss of ` 4.16 billion due to the impact
of additional provision for Indian Motor Third Party Pool (the Pool) losses. The consolidated return on
average equity increased from 13.00% in fiscal 2012 to 14.66% in fiscal 2013.
Profit after tax of ICICI Life increased from ` 13.84 billion in fiscal 2012 to ` 14.96 billion in fiscal 2013 due
to increase in investment income and lower operating expenses as well as the continued income stream
from business sold in prior years. Investment income increased primarily due to increase in average
non-linked assets under management and higher yields on debt portfolio. The increase was offset, in
part, by increase in claims and benefits paid and commission expenses. New business annual premium
equivalent increased by 13.3% from ` 31.18 billion during fiscal 2012 to ` 35.32 billion during fiscal 2013.
ICICI General made profit after tax of ` 3.06 billion in fiscal 2013 compared to loss of ` 4.16 billion in fiscal
2012 primary due to the impact of additional provision of the Pool losses during fiscal 2012 and due to
higher premium income, investment income and commission income during fiscal 2013. In accordance
with Insurance Regulatory and Development Authority guidelines, ICICI General, together with all other
general insurance companies participated in the Pool, administered by the General Insurance Corporation
of India covering third party risks of commercial vehicles, from April 1, 2007. As per Insurance Regulatory
and Development Authority direction effective March 31, 2012, the Pool was dismantled on a clean cut
basis and general insurance companies were required to recognise the Pool liabilities as per loss ratios
estimated by GAD UK with the option to recognise the same over a three year period. ICICI General had
decided to recognise the additional liabilities of the Pool during fiscal 2012 and therefore, the loss of ICICI
General of ` 4.16 billion for fiscal 2012 included impact of additional Pool losses of ` 6.85 billion. During
fiscal 2013, the Appointed Actuary carried out re-assessment of liabilities relating to policies underwritten
by ICICI General for risks commencing from fiscal 2008 to fiscal 2012. Based on the re-assessment, ICICI
General has recognised additional provision of ` 1.02 billion for fiscal 2013.
Profit after tax of ICICI Bank Canada increased from ` 1.66 billion (CAD 34.4 million) in fiscal 2012 to
` 2.37 billion (CAD 43.6 million) in fiscal 2013 primarily due to increase in net interest income and lower
provisions. The increase in net interest income was due to increase in net interest margin.