ICICI Bank 2013 Annual Report Download - page 88
Download and view the complete annual report
Please find page 88 of the 2013 ICICI Bank annual report below. You can navigate through the pages in the report by either clicking on the pages listed below, or by using the keyword search tool below to find specific information within the annual report.-
 1
1 -
2
-
3
-
4
-
5
-
6
-
7
-
8
-
9
-
10
-
11
-
12
-
13
-
14
-
15
-
16
-
17
-
18
-
19
-
20
-
21
-
22
-
23
-
24
-
25
-
26
-
27
-
28
-
29
-
30
-
31
-
32
-
33
-
34
-
35
-
36
-
37
-
38
-
39
-
40
-
41
-
42
-
43
-
44
-
45
-
46
-
47
-
48
-
49
-
50
-
51
-
52
-
53
-
54
-
55
-
56
-
57
-
58
-
59
-
60
-
61
-
62
-
63
-
64
-
65
-
66
-
67
-
68
-
69
-
70
-
71
-
72
-
73
-
74
-
75
-
76
-
77
-
 78
78 -
 79
79 -
 80
80 -
 81
81 -
 82
82 -
 83
83 -
 84
84 -
 85
85 -
 86
86 -
 87
87 -
 88
88 -
 89
89 -
 90
90 -
 91
91 -
 92
92 -
 93
93 -
 94
94 -
 95
95 -
 96
96 -
 97
97 -
 98
98 -
99
-
100
-
101
-
102
-
103
-
104
-
105
-
106
-
107
-
108
-
109
-
110
-
111
-
112
-
113
-
114
-
115
-
116
-
117
-
118
-
119
-
120
-
121
-
122
-
123
-
124
-
125
-
126
-
127
-
128
-
129
-
130
-
131
-
132
-
133
-
134
-
135
-
136
-
137
-
138
-
139
-
140
-
141
-
142
-
143
-
144
-
145
-
146
-
147
-
148
-
149
-
150
-
151
-
152
-
153
-
154
-
155
-
156
-
157
-
158
-
159
-
160
-
161
-
162
-
163
-
164
-
165
-
166
-
167
-
168
-
169
-
170
-
171
-
172
-
173
-
174
-
175
-
176
-
177
-
178
-
179
-
180
-
181
-
182
-
183
-
184
-
185
-
186
-
187
-
188
-
189
-
190
-
191
-
192
-
193
-
194
-
195
-
196
-
197
-
198
-
199
-
200
-
201
-
202
-
203
-
204
-
205
-
206
-
207
-
208
-
209
-
210
-
211
-
212
-
213
-
214
-
215
-
216
-
217
-
218
-
219
-
220
 |
 |

F10
At
31.03.2013
At
31.03.2012
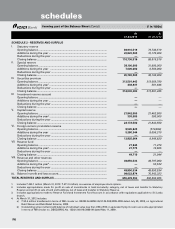
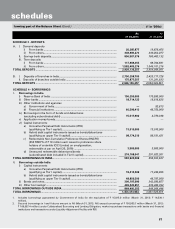
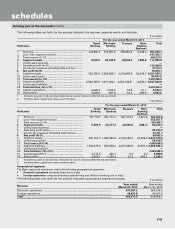
SCHEDULE 10 - FIXED ASSETS
I. Premises
At cost at March 31 of preceding year ..................................................................... 38,625,073 37,997,195
Additions during the year .......................................................................................... 1,124,842 690,890
Deductions during the year ....................................................................................... (927,636) (63,012)
Depreciation to date1 .................................................................................................. (7,543,258) (6,916,047)
Net block ..................................................................................................................... 31,279,021 31,709,026
II. Other fixed assets (including furniture and fixtures)
At cost at March 31 of preceding year ..................................................................... 38,319,238 35,777,378
Additions during the year .......................................................................................... 4,521,473 2,997,878
Deductions during the year ....................................................................................... (2,526,697) (456,018)
Depreciation to date2 .................................................................................................. (27,470,762) (26,275,723)
Net block .................................................................................................................... 12,843,252 12,043,515
III. Assets given on lease
At cost at March 31 of preceding year ..................................................................... 17,299,544 17,300,087
Additions during the year .......................................................................................... ——
Deductions during the year ....................................................................................... —(543)
Depreciation to date, accumulated lease adjustment and provisions3 .................... (14,951,230) (14,905,215)
Net block ..................................................................................................................... 2,348,314 2,394,329
TOTAL FIXED ASSETS ....................................................................................................... 46,470,587 46,146,870
1. Includes depreciation charge amounting to ` 1,137.0 million (March 31, 2012: ` 1,230.9 million).
2. Includes depreciation charge amounting to ` 3,436.4 million (March 31, 2012: ` 3,591.8 million).
3. Includes depreciation charge/lease adjustment amounting to ` 328.2 million (March 31, 2012: ` 422.6 million).
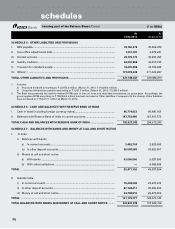
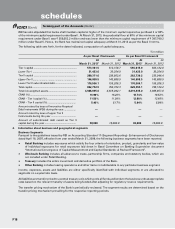
SCHEDULE 11 - OTHER ASSETS
I. Inter-office adjustments (net) ..................................................................................... ——
II. Interest accrued .......................................................................................................... 44,902,010 42,175,150
III. Tax paid in advance/tax deducted at source (net) .................................................... 36,098,478 34,161,502
I V. Stationery and stamps ............................................................................................... 10,045 10,308
V. Non-banking assets acquired in satisfaction of claims1 ........................................... 576,833 600,575
VI. Advances for capital assets ...................................................................................... 1,154,106 1,344,889
VII. Deposits ...................................................................................................................... 10,868,027 10,669,329
VIII. Deferred tax asset (net) .............................................................................................. 24,793,018 25,453,167
IX. Others2 ........................................................................................................................ 172,468,175 234,956,038
TOTAL OTHER ASSETS ...................................................................................................... 290,870,692 349,370,958
1. Includes certain non-banking assets acquired in satisfaction of claims which are in the process of being transferred in the Bank’s name.
2. The Bank has presented the mark-to-market (MTM) gain or loss on forex and derivative transactions on gross basis. Accordingly, the
gross positive MTM amounting to ` 113,239.6 million has been included in Other assets. Consequent to the change, Other assets have
increased by ` 154,217.1 million at March 31, 2012.
SCHEDULE 12 - CONTINGENT LIABILITIES
I. Claims against the Bank not acknowledged as debts .............................................. 36,373,051 29,310,352
II. Liability for partly paid investments .......................................................................... 128,050 128,050
III. Liability on account of outstanding forward exchange contracts1 ........................... 2,838,503,955 3,560,050,874
I V. Guarantees given on behalf of constituents
a) In India .................................................................................................................... 717,848,338 720,946,196
b) Outside India .......................................................................................................... 226,321,011 234,068,666
V. Acceptances, endorsements and other obligations ................................................. 621,180,725 568,856,614
VI. Currency swaps1 ......................................................................................................... 565,474,647 616,403,680
VII. Interest rate swaps, currency options and interest rate futures1 ............................. 2,855,937,706 3,362,012,187
VIII. Other items for which the Bank is contingently liable .............................................. 38,125,663 62,874,440
TOTAL CONTINGENT LIABILITIES ................................................................................... 7,899,893,146 9,154,651,059
1. Represents notional amount.
(` in ‘000s)
forming part of the Balance Sheet (Contd.)
schedules