ICICI Bank 2013 Annual Report Download - page 71
Download and view the complete annual report
Please find page 71 of the 2013 ICICI Bank annual report below. You can navigate through the pages in the report by either clicking on the pages listed below, or by using the keyword search tool below to find specific information within the annual report.
Annual Report 2012-2013 69
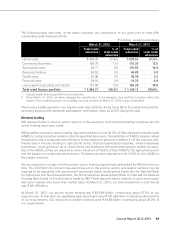
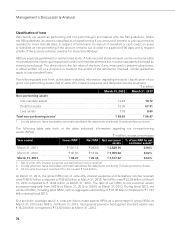
The following table sets forth, at the dates indicated, the composition of our gross (net of write-offs)
outstanding retail finance portfolio.
` in billion, except percentages
March 31, 2012 March 31, 2013
Total retail
advances
% of
total retail
advances
Total retail
advances
% of
total retail
advances
Home loans ` 489.40 47.6% ` 578.63 51.5%
Commercial business 180.70 17.5 151.25 13.5
Automobile loans 94.71 9.2 115.85 10.3
Business banking 56.52 5.5 43.85 3.9
Credit cards 45.96 4.5 36.39 3.2
Personal loans 29.52 2.9 31.75 2.8
Loans against securities and others1131.90 12.8 166.39 14.8
Total retail finance portfolio ` 1,028.71 100.0% ` 1,124.11 100.0%
1. Include dealer financing portfolio and rural loans.
2. From March 31, 2013, we have changed the classification of the domestic loan portfolio to better reflect the
nature of the underlying loans. Accordingly, our loan portfolio at March 31, 2012 is also reclassified.
There was a healthy growth in our organic retail loan portfolio during fiscal 2013. Our retail loan portfolio,
excluding buyouts and inter-bank participation certificates, grew by 25.6% during the year.
Directed lending
RBI requires banks to lend to certain sectors of the economy. Such directed lending comprises priority
sector lending and export credit.
RBI guideline on priority sector lending requires the banks to lend 40.0% of their adjusted net bank credit
(ANBC) to certain activities carried out by the specified borrowers. The definition of ANBC includes certain
investments and is computed with reference to the respective amounts at March 31 of the previous year.
Priority sector includes lending to agricultural sector, food and agri-based industries, small enterprises/
businesses, housing finance up to certain limits and lending to borrowers belonging to weaker sections.
Out of the 40.0%, banks are required to lend a minimum of 18.0% of their ANBC to the agriculture sector
and the balance to certain specified sectors. The banks are also required to lend 10.0% of their ANBC to
the weaker sections.
We are required to comply with the priority sector lending requirements prescribed by RBI from time to
time. The shortfall in the amount required to be lent to the priority sectors and weaker sections may be
required to be deposited with government sponsored Indian development banks like the National Bank
for Agriculture and Rural Development, the Small Industries Development Bank of India and the National
Housing Bank based on the allocations made by RBI. These deposits have a maturity of up to seven years
and carry interest rates lower than market rates. At March 31, 2013, our total investment in such bonds
was ` 201.98 billion.
At March 31, 2013, our priority sector lending was ` 674.88 billion, constituting about 87.5% of our
requirements. At that date, the qualifying agriculture loans were ` 191.86 billion constituting about 55.3%
of our requirements. Our advances to weaker sections were ` 48.63 billion constituting about 25.2% of
our requirements.


