ICICI Bank 2013 Annual Report Download - page 179
Download and view the complete annual report
Please find page 179 of the 2013 ICICI Bank annual report below. You can navigate through the pages in the report by either clicking on the pages listed below, or by using the keyword search tool below to find specific information within the annual report.-
 1
1 -
2
-
3
-
4
-
5
-
6
-
7
-
8
-
9
-
10
-
11
-
12
-
13
-
14
-
15
-
16
-
17
-
18
-
19
-
20
-
21
-
22
-
23
-
24
-
25
-
26
-
27
-
28
-
29
-
30
-
31
-
32
-
33
-
34
-
35
-
36
-
37
-
38
-
39
-
40
-
41
-
42
-
43
-
44
-
45
-
46
-
47
-
48
-
49
-
50
-
51
-
52
-
53
-
54
-
55
-
56
-
57
-
58
-
59
-
60
-
61
-
62
-
63
-
64
-
65
-
66
-
67
-
68
-
69
-
70
-
71
-
72
-
73
-
74
-
75
-
76
-
77
-
78
-
79
-
80
-
81
-
82
-
83
-
84
-
85
-
86
-
87
-
88
-
89
-
90
-
91
-
92
-
93
-
94
-
95
-
96
-
97
-
98
-
99
-
100
-
101
-
102
-
103
-
104
-
105
-
106
-
107
-
108
-
109
-
110
-
111
-
112
-
113
-
114
-
115
-
116
-
117
-
118
-
119
-
120
-
121
-
122
-
123
-
124
-
125
-
126
-
127
-
128
-
129
-
130
-
131
-
132
-
133
-
134
-
135
-
136
-
137
-
138
-
139
-
140
-
141
-
142
-
143
-
144
-
145
-
146
-
147
-
148
-
149
-
150
-
151
-
152
-
153
-
154
-
155
-
156
-
157
-
158
-
159
-
160
-
161
-
162
-
163
-
164
-
165
-
166
-
167
-
168
-
 169
169 -
 170
170 -
 171
171 -
 172
172 -
 173
173 -
 174
174 -
 175
175 -
 176
176 -
 177
177 -
 178
178 -
 179
179 -
 180
180 -
 181
181 -
 182
182 -
 183
183 -
 184
184 -
 185
185 -
 186
186 -
 187
187 -
 188
188 -
 189
189 -
190
-
191
-
192
-
193
-
194
-
195
-
196
-
197
-
198
-
199
-
200
-
201
-
202
-
203
-
204
-
205
-
206
-
207
-
208
-
209
-
210
-
211
-
212
-
213
-
214
-
215
-
216
-
217
-
218
-
219
-
220
 |
 |

F101
of bank’s exposures to qualifying and non qualifying central counter-parties on account of derivatives and
securities financing transactions.
RBI, through its circular issued in March 2013, deferred the introduction of credit value adjustment risk capital
charge for over the counter derivatives. Credit value adjustment captures risk of mark-to-market losses due
to deterioration in the credit worthiness of counterparty. Credit value adjustment risk capital charges would
become effective from January 1, 2014.
The Bank continues to monitor further developments and believes that its current robust capital adequacy
position and demonstrated track record of access to domestic and overseas markets for capital raising will
enable us to adapt to the Basel III framework.
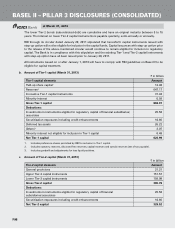
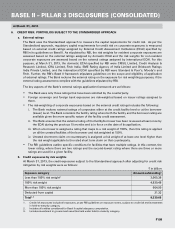
b. Capital requirements for various risk areas (March 31, 2013)
As required by RBI guidelines on Basel II, the Bank’s capital requirements have been computed using the
Standardised approach for credit risk, Standardised Duration method for market risk and Basic Indicator
approach for operational risk. The minimum capital required to be held at 9.00% for credit, market and
operational risks is given below:
` in billion
Amount1
I. Capital required for credit risk 377.18
- for portfolio subject to Standardised approach 376.44
- for securitisation exposure 0.74
II. Capital required for market risk 32.46
- for interest rate risk226.65
- for foreign exchange (including gold) risk 0.79
- for equity position risk 5.02
III. Capital required for operational risk 27.49
Total capital requirement (I+II+III) 437.13
Total capital funds of the Bank 956.51
Total risk weighted assets 4,856.98
Capital adequacy ratio 19.69%
1. Includes all entities considered for Basel II capital adequacy computation.
2. Includes capital required of ` 1.43 billion for securitisation exposure.
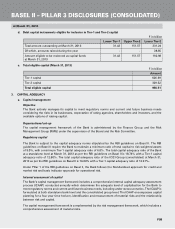
The capital ratios of the Bank and its banking subsidiaries at March 31, 2013 are as follows:
Capital ratios ICICI Bank Ltd
(consolidated)1
ICICI Bank Ltd
(standalone)1
ICICI Bank UK
PLC1
ICICI Bank
Canada1, 2
ICICI Bank
Eurasia LLC1, 3
Tier-1 capital ratio 12.91% 12.80% 19.26% 31.81% n.a.
Total capital ratio 19.69% 18.74% 30.78% 33.22% 27.04%
1. Computed as per capital adequacy guidelines issued by regulators of respective jurisdictions.
2. As per OSFI Basel III guidelines
3. Tier-1 capital ratio is not required to be reported in line with regulatory norms stipulated by the Central Bank of Russia.
4. RISK MANAGEMENT FRAMEWORK
As a financial intermediary, the Bank is exposed to various types of risks including credit, market, liquidity,
operational, legal, compliance and reputation risks. The objective of the risk management framework at the Bank
is to ensure that various risks are understood, measured and monitored and that the policies and procedures
established to address these risks are strictly adhered to.
BASEL II – PILLAR 3 DISCLOSURES (CONSOLIDATED)
at March 31, 2013