ICICI Bank 2013 Annual Report Download - page 66
Download and view the complete annual report
Please find page 66 of the 2013 ICICI Bank annual report below. You can navigate through the pages in the report by either clicking on the pages listed below, or by using the keyword search tool below to find specific information within the annual report.-
 1
1 -
2
-
3
-
4
-
5
-
6
-
7
-
8
-
9
-
10
-
11
-
12
-
13
-
14
-
15
-
16
-
17
-
18
-
19
-
20
-
21
-
22
-
23
-
24
-
25
-
26
-
27
-
28
-
29
-
30
-
31
-
32
-
33
-
34
-
35
-
36
-
37
-
38
-
39
-
40
-
41
-
42
-
43
-
44
-
45
-
46
-
47
-
48
-
49
-
50
-
51
-
52
-
53
-
54
-
55
-
 56
56 -
 57
57 -
 58
58 -
 59
59 -
 60
60 -
 61
61 -
 62
62 -
 63
63 -
 64
64 -
 65
65 -
 66
66 -
 67
67 -
 68
68 -
 69
69 -
 70
70 -
 71
71 -
 72
72 -
 73
73 -
 74
74 -
 75
75 -
 76
76 -
77
-
78
-
79
-
80
-
81
-
82
-
83
-
84
-
85
-
86
-
87
-
88
-
89
-
90
-
91
-
92
-
93
-
94
-
95
-
96
-
97
-
98
-
99
-
100
-
101
-
102
-
103
-
104
-
105
-
106
-
107
-
108
-
109
-
110
-
111
-
112
-
113
-
114
-
115
-
116
-
117
-
118
-
119
-
120
-
121
-
122
-
123
-
124
-
125
-
126
-
127
-
128
-
129
-
130
-
131
-
132
-
133
-
134
-
135
-
136
-
137
-
138
-
139
-
140
-
141
-
142
-
143
-
144
-
145
-
146
-
147
-
148
-
149
-
150
-
151
-
152
-
153
-
154
-
155
-
156
-
157
-
158
-
159
-
160
-
161
-
162
-
163
-
164
-
165
-
166
-
167
-
168
-
169
-
170
-
171
-
172
-
173
-
174
-
175
-
176
-
177
-
178
-
179
-
180
-
181
-
182
-
183
-
184
-
185
-
186
-
187
-
188
-
189
-
190
-
191
-
192
-
193
-
194
-
195
-
196
-
197
-
198
-
199
-
200
-
201
-
202
-
203
-
204
-
205
-
206
-
207
-
208
-
209
-
210
-
211
-
212
-
213
-
214
-
215
-
216
-
217
-
218
-
219
-
220
 |
 |

64
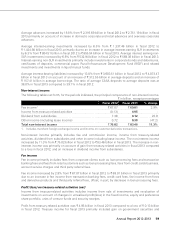
billion at March 31, 2013. Total deposits at March 31, 2013 were 66.9% of the funding (i.e. deposits and
borrowings, other than preference share capital). The current and savings account deposits increased
from ` 1,110.19 billion at March 31, 2012 to ` 1,225.77 billion at March 31, 2013.
Borrowings (including subordinated debt and preference share capital)
Borrowings increased by 3.7% from ` 1,401.65 billion at March 31, 2012 to ` 1,453.41 billion at March
31, 2013. The borrowings of overseas branches (including offshore banking unit) decreased in USD terms
by 5.4% from US$ 13.0 billion at March 31, 2012 to US$ 12.3 billion at March 31, 2013. In rupee terms,
borrowings of overseas branches (including offshore banking unit) increased by 0.7% from ` 663.91
billion at March 31, 2012 to ` 668.72 billion at March 31, 2013. The capital-eligible borrowings, other than
preference share capital, increased from ` 376.15 billion at March 31, 2012 to ` 396.62 billion at March
31, 2013.
Equity share capital and reserves
Equity share capital and reserves increased from ` 604.05 billion at March 31, 2012 to ` 667.06 billion at
March 31, 2013 primarily due to annual accretion to reserves out of profit.
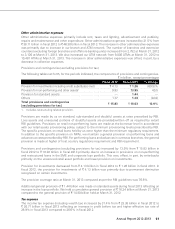
Other liabilities
Other liabilities decreased from ` 329.99 billion at March 31, 2012 to ` 321.34 billion at March 31, 2013.
At March 31, 2013, we have presented mark-to-market on forex and derivatives trading transactions
(including revaluation on outstanding funding swaps) and interest accrual on hedge swaps on gross
basis. Accordingly, the gross negative mark-to-market amounting to ` 108.26 billion has been included in
Other liabilities at March 31, 2013. Consequent to the change, Other liabilities have increased by ` 154.22
billion at March 31, 2012.
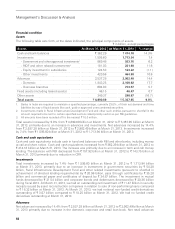
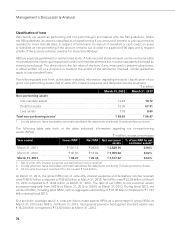
Off balance sheet items, commitments and contingencies
The following table sets forth, for the periods indicated, the principal components of contingent liabilities.
` in billion
Assets At March 31, 2012 At March 31, 2013
Claims against the Bank, not acknowledged as debts ` 29.31 ` 36.37
Liability for partly paid investments 0.13 0.13
Notional principal amount of outstanding forward
exchange contracts 3,560.05 2,838.50
Guarantees given on behalf of constituents 955.01 944.17
Acceptances, endorsements and other obligations 568.86 621.18
Notional principal amount of currency swaps 616.40 565.47
Notional principal amount of interest rate swaps and currency
options and interest rate futures 3,362.01 2,855.94
Other items for which the Bank is contingently liable 62.88 38.13
Total ` 9,154.65 ` 7,899.89
We enter into foreign exchange forwards, options, swaps and other derivative products to enable customers
to transfer, modify or reduce their foreign exchange and interest rate risk and to manage our own interest
rate and foreign exchange positions. We manage our foreign exchange and interest rate risk with reference
to limits set by RBI as well as those set internally. An interest rate swap does not entail exchange of notional
principal and the cash flow arises on account of the difference between interest rate pay and receive legs
Management’s Discussion & Analysis