ICICI Bank 2013 Annual Report Download - page 110
Download and view the complete annual report
Please find page 110 of the 2013 ICICI Bank annual report below. You can navigate through the pages in the report by either clicking on the pages listed below, or by using the keyword search tool below to find specific information within the annual report.-
 1
1 -
2
-
3
-
4
-
5
-
6
-
7
-
8
-
9
-
10
-
11
-
12
-
13
-
14
-
15
-
16
-
17
-
18
-
19
-
20
-
21
-
22
-
23
-
24
-
25
-
26
-
27
-
28
-
29
-
30
-
31
-
32
-
33
-
34
-
35
-
36
-
37
-
38
-
39
-
40
-
41
-
42
-
43
-
44
-
45
-
46
-
47
-
48
-
49
-
50
-
51
-
52
-
53
-
54
-
55
-
56
-
57
-
58
-
59
-
60
-
61
-
62
-
63
-
64
-
65
-
66
-
67
-
68
-
69
-
70
-
71
-
72
-
73
-
74
-
75
-
76
-
77
-
78
-
79
-
80
-
81
-
82
-
83
-
84
-
85
-
86
-
87
-
88
-
89
-
90
-
91
-
92
-
93
-
94
-
95
-
96
-
97
-
98
-
99
-
 100
100 -
 101
101 -
 102
102 -
 103
103 -
 104
104 -
 105
105 -
 106
106 -
 107
107 -
 108
108 -
 109
109 -
 110
110 -
 111
111 -
 112
112 -
 113
113 -
 114
114 -
 115
115 -
 116
116 -
 117
117 -
 118
118 -
 119
119 -
 120
120 -
121
-
122
-
123
-
124
-
125
-
126
-
127
-
128
-
129
-
130
-
131
-
132
-
133
-
134
-
135
-
136
-
137
-
138
-
139
-
140
-
141
-
142
-
143
-
144
-
145
-
146
-
147
-
148
-
149
-
150
-
151
-
152
-
153
-
154
-
155
-
156
-
157
-
158
-
159
-
160
-
161
-
162
-
163
-
164
-
165
-
166
-
167
-
168
-
169
-
170
-
171
-
172
-
173
-
174
-
175
-
176
-
177
-
178
-
179
-
180
-
181
-
182
-
183
-
184
-
185
-
186
-
187
-
188
-
189
-
190
-
191
-
192
-
193
-
194
-
195
-
196
-
197
-
198
-
199
-
200
-
201
-
202
-
203
-
204
-
205
-
206
-
207
-
208
-
209
-
210
-
211
-
212
-
213
-
214
-
215
-
216
-
217
-
218
-
219
-
220
 |
 |
F32
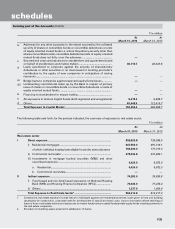
forming part of the Accounts (Contd.)
schedules
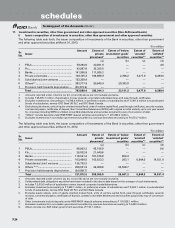
` in million, except number of accounts
Type of Restructuring Others Total
Sr.
no.
Asset Classification Details Standard
(a)
Sub-
Standard
(b)
Doubtful
(c)
Loss
(d)
Total
(e)
Standard
(a)
Sub-
Standard
(b)
Doubtful
(c)
Loss
(d)
Total
(e)
1. Restructured Accounts at April 1, 2012
No. of borrowers ....................................... 36 3 494 —533 63 4 504 2 573
Amount outstanding ................................. 22,509.1 577.4 3,085.5 —26,172.0 50,073.3 732.3 4,618.6 113.9 55,538.1
Provision thereon ...................................... 981.3 86.6 2,136.9 —3,204.8 4,528.9 214.9 2,936.7 113.9 7,794.4
2. Fresh restructuring during the year ended March 31, 2013
No. of borrowers ....................................... 9 2 1 —12 23 2 1 —26
Amount outstanding ................................... 8,057.7 1,851.5 387.1 —10,296.3 18,139.8 1,851.5 387.1 —20,378.4
Provision thereon ...................................... 745.7 158.9 387.1 —1,291.7 1,564.9 158.9 387.1 —2,110.9
3. Upgradations to restructured standard category during the year ended March 31, 20131
No. of borrowers ....................................... 148 —(148) — — 148 —(148) — —
Amount outstanding ................................. 197.0 —(232.7) —N.A.2197.0 —(232.7) —N.A.2
Provision thereon ...................................... 6.1 —(129.5) —N.A.26.1 —(129.5) —N.A.2
4. Restructured standard advances at April 1, 2012, which cease to attract higher provisioning and/or additional risk weight at March 31, 2013
and hence need not be shown as restructured standard advances at April 1, 2013
No. of borrowers ....................................... (6) N.A. N.A. N.A. (6) (7) N.A. N.A. N.A. (7)
Amount outstanding ................................. (2,397.4) N.A. N.A. N.A. (2,397.4) (2,458.6) N.A. N.A. N.A. (2,458.6)
Provision thereon ...................................... (117.5) N.A. N.A. N.A. (117.5) (117.6) N.A. N.A. N.A. (117.6)
5. Downgradations of restructured accounts during the year ended March 31, 20131
No. of borrowers ....................................... (31) 3 24 4 —(36) 2 28 6 —
Amount outstanding ................................. (2,481.7) (573.0) 2,745.2 138.1 N.A.2(4,536.0) (727.9) 4,878.7 295.1 N.A.2
Provision thereon ...................................... (303.4) (85.9) 1,108.9 138.1 N.A.2(481.0) (214.2) 2,280.4 295.1 N.A.2
6. Write-offs of restructured accounts during the year ended March 31, 2013
No. of borrowers ....................................... — — — — — — — (2) (1) (3)
Amount outstanding ................................. — — — — — — — (158.1) (76.9) (235.0)
7. Restructured Accounts at March 31, 2013
No. of borrowers ....................................... 141 8 283 4 436 174 8 295 7 484
Amount outstanding ................................. 22,891.0 1,855.9 5,650.6 138.1 30,535.6 58,252.2 1,855.9 9,004.8 316.2 69,429.1
Provision thereon ...................................... 1,469.0 159.6 3,738.0 138.1 5,504.7 5,103.8 159.6 5,955.6 316.2 11,535.2
1. In cases upgraded to restructured standard category and in cases downgraded to lower asset classification, the amount shown as deleted represents the
outstanding at March 31, 2012 and that shown in addition represents outstanding at March 31, 2013.
2. The amounts outstanding and the provision thereon are not presented as the number of borrowers are Nil.