ICICI Bank 2013 Annual Report Download - page 159
Download and view the complete annual report
Please find page 159 of the 2013 ICICI Bank annual report below. You can navigate through the pages in the report by either clicking on the pages listed below, or by using the keyword search tool below to find specific information within the annual report.-
 1
1 -
2
-
3
-
4
-
5
-
6
-
7
-
8
-
9
-
10
-
11
-
12
-
13
-
14
-
15
-
16
-
17
-
18
-
19
-
20
-
21
-
22
-
23
-
24
-
25
-
26
-
27
-
28
-
29
-
30
-
31
-
32
-
33
-
34
-
35
-
36
-
37
-
38
-
39
-
40
-
41
-
42
-
43
-
44
-
45
-
46
-
47
-
48
-
49
-
50
-
51
-
52
-
53
-
54
-
55
-
56
-
57
-
58
-
59
-
60
-
61
-
62
-
63
-
64
-
65
-
66
-
67
-
68
-
69
-
70
-
71
-
72
-
73
-
74
-
75
-
76
-
77
-
78
-
79
-
80
-
81
-
82
-
83
-
84
-
85
-
86
-
87
-
88
-
89
-
90
-
91
-
92
-
93
-
94
-
95
-
96
-
97
-
98
-
99
-
100
-
101
-
102
-
103
-
104
-
105
-
106
-
107
-
108
-
109
-
110
-
111
-
112
-
113
-
114
-
115
-
116
-
117
-
118
-
119
-
120
-
121
-
122
-
123
-
124
-
125
-
126
-
127
-
128
-
129
-
130
-
131
-
132
-
133
-
134
-
135
-
136
-
137
-
138
-
139
-
140
-
141
-
142
-
143
-
144
-
145
-
146
-
147
-
148
-
 149
149 -
 150
150 -
 151
151 -
 152
152 -
 153
153 -
 154
154 -
 155
155 -
 156
156 -
 157
157 -
 158
158 -
 159
159 -
 160
160 -
 161
161 -
 162
162 -
 163
163 -
 164
164 -
 165
165 -
 166
166 -
 167
167 -
 168
168 -
 169
169 -
170
-
171
-
172
-
173
-
174
-
175
-
176
-
177
-
178
-
179
-
180
-
181
-
182
-
183
-
184
-
185
-
186
-
187
-
188
-
189
-
190
-
191
-
192
-
193
-
194
-
195
-
196
-
197
-
198
-
199
-
200
-
201
-
202
-
203
-
204
-
205
-
206
-
207
-
208
-
209
-
210
-
211
-
212
-
213
-
214
-
215
-
216
-
217
-
218
-
219
-
220
 |
 |

F81
forming part of the Consolidated Accounts (Contd.)
schedules
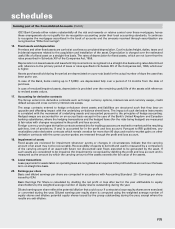
ICICI Life:
ICICI Prudential Life Insurance Company has formulated various ESOS schemes, namely Founder I, Founder II,
2004-2005, 2005-2006, 2006-2007 and 2007-2008.
For ICICI Prudential Life Insurance Company there is no compensation cost for the year ended March 31, 2013 based
on the intrinsic value of options. If the entity had used the fair value approach for accounting of options, based on the
binomial tree model, compensation cost for the year ended March 31, 2013 would have been higher by ` 2.4 million
(March 31, 2012: ` 34.3 million).
The following table sets forth, for the periods indicated, a summary of the status of the stock option plan of ICICI
Prudential Life Insurance Company.
`, except number of options
Stock options outstanding
Year ended March 31, 2013 Year ended March 31, 2012
Particulars
Number of
shares
Weighted
Average
Exercise Price
Number of
shares
Weighted
Average
Exercise Price
Outstanding at the beginning of the year ....................... 12,778,898 211.43 13,565,154 210.87
Add: Granted during the year ......................................... — — — —
Less: Forfeited/lapsed during the year ........................... 401,169 275.60 398,281 302.84
Less: Exercised during the year ...................................... 90,125 70.00 387,975 94.00
Outstanding at the end of the year ................................. 12,287,604 210.60 12,778,898 211.43
Options exercisable ......................................................... 12,287,604 210.60 11,256,348 185.89
The following table sets forth, summary of stock options outstanding of ICICI Prudential Life Insurance Company at
March 31, 2013.
Range of exercise price
(` per share)
Number of shares
arising out of
options
(Number of shares)
Weighted average
exercise price
(` per share)
Weighted average
remaining
contractual life
(Number of years)
30-400 12,287,604 210.60 4.10
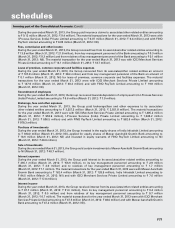
ICICI General:
ICICI Lombard General Insurance Company has formulated various ESOS schemes for their employees. There is no
compensation cost for the year ended March 31, 2013 based on the intrinsic value of options. If the entity had used the
fair value approach for accounting of options, based on the binomial tree model, compensation cost for the year ended
March 31, 2013 would have been higher by ` 7.5 million (March 31, 2012: ` 167.2 million).