ICICI Bank 2013 Annual Report Download - page 57
Download and view the complete annual report
Please find page 57 of the 2013 ICICI Bank annual report below. You can navigate through the pages in the report by either clicking on the pages listed below, or by using the keyword search tool below to find specific information within the annual report.-
 1
1 -
2
-
3
-
4
-
5
-
6
-
7
-
8
-
9
-
10
-
11
-
12
-
13
-
14
-
15
-
16
-
17
-
18
-
19
-
20
-
21
-
22
-
23
-
24
-
25
-
26
-
27
-
28
-
29
-
30
-
31
-
32
-
33
-
34
-
35
-
36
-
37
-
38
-
39
-
40
-
41
-
42
-
43
-
44
-
45
-
46
-
 47
47 -
 48
48 -
 49
49 -
 50
50 -
 51
51 -
 52
52 -
 53
53 -
 54
54 -
 55
55 -
 56
56 -
 57
57 -
 58
58 -
 59
59 -
 60
60 -
 61
61 -
 62
62 -
 63
63 -
 64
64 -
 65
65 -
 66
66 -
 67
67 -
68
-
69
-
70
-
71
-
72
-
73
-
74
-
75
-
76
-
77
-
78
-
79
-
80
-
81
-
82
-
83
-
84
-
85
-
86
-
87
-
88
-
89
-
90
-
91
-
92
-
93
-
94
-
95
-
96
-
97
-
98
-
99
-
100
-
101
-
102
-
103
-
104
-
105
-
106
-
107
-
108
-
109
-
110
-
111
-
112
-
113
-
114
-
115
-
116
-
117
-
118
-
119
-
120
-
121
-
122
-
123
-
124
-
125
-
126
-
127
-
128
-
129
-
130
-
131
-
132
-
133
-
134
-
135
-
136
-
137
-
138
-
139
-
140
-
141
-
142
-
143
-
144
-
145
-
146
-
147
-
148
-
149
-
150
-
151
-
152
-
153
-
154
-
155
-
156
-
157
-
158
-
159
-
160
-
161
-
162
-
163
-
164
-
165
-
166
-
167
-
168
-
169
-
170
-
171
-
172
-
173
-
174
-
175
-
176
-
177
-
178
-
179
-
180
-
181
-
182
-
183
-
184
-
185
-
186
-
187
-
188
-
189
-
190
-
191
-
192
-
193
-
194
-
195
-
196
-
197
-
198
-
199
-
200
-
201
-
202
-
203
-
204
-
205
-
206
-
207
-
208
-
209
-
210
-
211
-
212
-
213
-
214
-
215
-
216
-
217
-
218
-
219
-
220
 |
 |

Annual Report 2012-2013 55
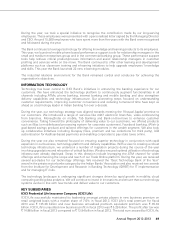
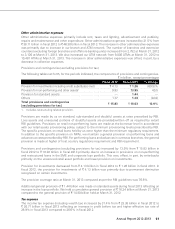
• In February 2013, RBI issued guidelines on the entry of new banks in the private sector including
eligibility criteria, structure, capital requirements, shareholding structure and corporate governance
practices. Select entities or groups in the private sector, entities in the public sector and non-banking
financial companies with a successful track record of at least ten years would be eligible to promote
banks. The initial minimum capital requirement for these entities is ` 5.00 billion, with foreign
shareholding not exceeding 49.0% for the first five years. Applications for setting up of new banks
have been sought by July 1, 2013.
• In March 2013, the Insurance Regulatory and Development Authority issued guidelines on non-
linked life insurance products which include limits on the commission rates payable by insurance
companies, introduction of minimum guaranteed surrender value and minimum death benefits. The
new guidelines would require life insurance companies to modify existing non-linked products which
do not comply with the revised guidelines.
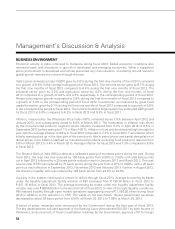
STANDALONE FINANCIALS AS PER INDIAN GAAP
Summary
During fiscal 2013, we focused on sustainable value creation by balancing growth, profitability and risk
management.
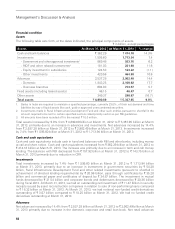
Our profit after tax increased by 28.8% from ` 64.65 billion in fiscal 2012 to ` 83.25 billion in fiscal 2013.
The increase in profit after tax was mainly due to 29.2% increase in net interest income and 11.3%
increase in non-interest income offset, in part, by a 14.8% increase in non-interest expenses and 13.9%
increase in provisions and contingencies (excluding provisions for tax). Net interest income increased by
29.2% from ` 107.34 billion in fiscal 2012 to ` 138.66 billion in fiscal 2013, reflecting an increase of 38
basis points in net interest margin and an increase of 13.5% in average interest-earning assets.
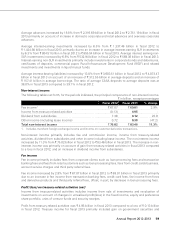
Non-interest income increased by 11.3% from ` 75.02 billion in fiscal 2012 to ` 83.46 billion in fiscal 2013.
The increase in non-interest income was primarily due to a gain of ` 4.95 billion from treasury-related
activities in fiscal 2013 compared to a loss of ` 0.13 billion in fiscal 2012 and an increase in dividend
income from subsidiaries from ` 7.36 billion in fiscal 2012 to ` 9.12 billion in fiscal 2013. Fee income
increased by 2.9% from ` 67.07 billion in fiscal 2012 to ` 69.01 billion in fiscal 2013.
Non-interest expenses increased by 14.8% from ` 78.50 billion in fiscal 2012 to ` 90.13 billion in fiscal
2013 primarily due to an increase in employee expenses and other administrative expenses. Provisions
and contingencies (excluding provisions for tax) increased by 13.9% from ` 15.83 billion in fiscal 2012 to
` 18.03 billion in fiscal 2013. The increase in provisions and contingencies (excluding provisions for tax)
was primarily due to an increase in provisions for non-performing and restructured loans in the Small &
Medium Enterprises (SME) and corporate loan portfolio.
Total assets increased by 9.8% from ` 4,890.69 billion at March 31, 2012 to ` 5,367.95 billion at March 31,
2013. Total deposits increased by 14.5% from ` 2,555.00 billion at March 31, 2012 to ` 2,926.14 billion at
March 31, 2013. Savings account deposits increased by 12.6% from ` 760.46 billion at March 31, 2012
to ` 856.51 billion at March 31, 2013. The current and savings account (CASA) ratio was 41.9% at March
31, 2013 compared to 43.5% at March 31, 2012. Term deposits increased by 17.7% from ` 1,444.81
billion at March 31, 2012 to ` 1,700.37 billion at March 31, 2013. Total advances increased by 14.4% from
` 2,537.28 billion at March 31, 2012 to ` 2,902.49 billion at March 31, 2013 primarily due to an increase
in the domestic corporate and retail loan book. The net non-performing asset ratio increased marginally
from 0.62% at March 31, 2012 to 0.64% at March 31, 2013.
We continued to expand our branch network in India. Our branch network in India increased from 2,752
branches and extension counters at March 31, 2012 to 3,100 branches and extension counters at March
31, 2013. We also increased our ATM network from 9,006 ATMs at March 31, 2012 to 10,481 ATMs at
March 31, 2013.