ICICI Bank 2013 Annual Report Download - page 156
Download and view the complete annual report
Please find page 156 of the 2013 ICICI Bank annual report below. You can navigate through the pages in the report by either clicking on the pages listed below, or by using the keyword search tool below to find specific information within the annual report.-
 1
1 -
2
-
3
-
4
-
5
-
6
-
7
-
8
-
9
-
10
-
11
-
12
-
13
-
14
-
15
-
16
-
17
-
18
-
19
-
20
-
21
-
22
-
23
-
24
-
25
-
26
-
27
-
28
-
29
-
30
-
31
-
32
-
33
-
34
-
35
-
36
-
37
-
38
-
39
-
40
-
41
-
42
-
43
-
44
-
45
-
46
-
47
-
48
-
49
-
50
-
51
-
52
-
53
-
54
-
55
-
56
-
57
-
58
-
59
-
60
-
61
-
62
-
63
-
64
-
65
-
66
-
67
-
68
-
69
-
70
-
71
-
72
-
73
-
74
-
75
-
76
-
77
-
78
-
79
-
80
-
81
-
82
-
83
-
84
-
85
-
86
-
87
-
88
-
89
-
90
-
91
-
92
-
93
-
94
-
95
-
96
-
97
-
98
-
99
-
100
-
101
-
102
-
103
-
104
-
105
-
106
-
107
-
108
-
109
-
110
-
111
-
112
-
113
-
114
-
115
-
116
-
117
-
118
-
119
-
120
-
121
-
122
-
123
-
124
-
125
-
126
-
127
-
128
-
129
-
130
-
131
-
132
-
133
-
134
-
135
-
136
-
137
-
138
-
139
-
140
-
141
-
142
-
143
-
144
-
145
-
 146
146 -
 147
147 -
 148
148 -
 149
149 -
 150
150 -
 151
151 -
 152
152 -
 153
153 -
 154
154 -
 155
155 -
 156
156 -
 157
157 -
 158
158 -
 159
159 -
 160
160 -
 161
161 -
 162
162 -
 163
163 -
 164
164 -
 165
165 -
 166
166 -
167
-
168
-
169
-
170
-
171
-
172
-
173
-
174
-
175
-
176
-
177
-
178
-
179
-
180
-
181
-
182
-
183
-
184
-
185
-
186
-
187
-
188
-
189
-
190
-
191
-
192
-
193
-
194
-
195
-
196
-
197
-
198
-
199
-
200
-
201
-
202
-
203
-
204
-
205
-
206
-
207
-
208
-
209
-
210
-
211
-
212
-
213
-
214
-
215
-
216
-
217
-
218
-
219
-
220
 |
 |

F78
forming part of the Consolidated Accounts (Contd.)
schedules
Dividend paid
During the year ended March 31, 2013, the Bank paid dividend to its key management personnel amounting to
` 6.7 million (March 31, 2012: ` 4.5 million). The dividend paid during the year ended March 31, 2013 to
Ms. Chanda Kochhar was ` 5.1 million (March 31, 2012: ` 3.8 million), to Mr. N. S. Kannan was ` 1.2 million (March 31, 2012:
` 0.7 million) and to Mr. K. Ramkumar was ` 0.4 million (March 31, 2012: Nil).
Remuneration to whole-time directors
Remuneration paid to the whole-time directors of the Bank during the year ended March 31, 2013 was ` 154.9 million
(March 31, 2012: ` 111.3 million). The remuneration paid for the year ended March 31, 2013 to Ms. Chanda Kochhar was
` 54.2 million (March 31, 2012: ` 37.7 million), to Mr. N. S. Kannan was ` 32.2 million (March 31, 2012: ` 25.0 million),
to Mr. K. Ramkumar was ` 42.7 million (March 31, 2012: ` 25.4 million) and to Mr. Rajiv Sabharwal was ` 25.8 million
(March 31, 2012: ` 23.2 million).
Sale of fixed assets
During the year ended March 31, 2013, the Bank sold fixed assets to its key management personnel amounting to
` 0.7 million (March 31, 2012: Nil). The material transaction for the year ended March 31, 2013 was with Mr. K. Ramkumar
amounting to ` 0.7 million (March 31, 2012: Nil).
Donation
During the year ended March 31, 2013, the Group has given donation to ICICI Foundation for Inclusive Growth amounting
to ` 104.0 million (March 31, 2012: ` 259.0 million).
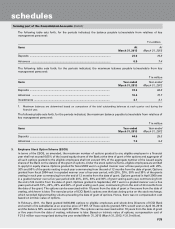
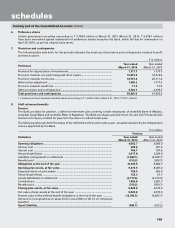
Related party balances
The following table sets forth, for the periods indicated, the balance payable to/receivable from its associates/other
related entities.
` in million
Items At
March 31, 2013
At
March 31, 2012
Deposits with the Group .................................................................................... 5,084.8 2,011.1
Advances ............................................................................................................ 305.5 1,004.8
Investments of the Group in related parties ..................................................... 1,903.6 955.0
Investments of related parties in the Group ..................................................... 15.0 15.0
Payables .............................................................................................................. 1,279.2 264.7
Guarantees issued by the Group ....................................................................... 0.1 0.1
The following table sets forth, for the periods indicated, the balance payable to/receivable from key management
personnel:
` in million, except number of shares
Items At
March 31, 2013
At
March 31, 2012
Deposits .............................................................................................................. 60.5 41.0
Advances ............................................................................................................ 5.7 9.2
Investments ........................................................................................................ 4.1 4.1
Employee Stock Options Outstanding (Numbers) ........................................... 3,172,500 2,701,500
Employee Stock Options Exercised1 ................................................................. 0.5 0.9
1. During the year ended March 31, 2013, 54,000 employee stock options were exercised by the key management personnel of the
Bank (March 31, 2012: 86,500), which have been reported at face value.