ICICI Bank 2013 Annual Report Download - page 105
Download and view the complete annual report
Please find page 105 of the 2013 ICICI Bank annual report below. You can navigate through the pages in the report by either clicking on the pages listed below, or by using the keyword search tool below to find specific information within the annual report.-
 1
1 -
2
-
3
-
4
-
5
-
6
-
7
-
8
-
9
-
10
-
11
-
12
-
13
-
14
-
15
-
16
-
17
-
18
-
19
-
20
-
21
-
22
-
23
-
24
-
25
-
26
-
27
-
28
-
29
-
30
-
31
-
32
-
33
-
34
-
35
-
36
-
37
-
38
-
39
-
40
-
41
-
42
-
43
-
44
-
45
-
46
-
47
-
48
-
49
-
50
-
51
-
52
-
53
-
54
-
55
-
56
-
57
-
58
-
59
-
60
-
61
-
62
-
63
-
64
-
65
-
66
-
67
-
68
-
69
-
70
-
71
-
72
-
73
-
74
-
75
-
76
-
77
-
78
-
79
-
80
-
81
-
82
-
83
-
84
-
85
-
86
-
87
-
88
-
89
-
90
-
91
-
92
-
93
-
94
-
 95
95 -
 96
96 -
 97
97 -
 98
98 -
 99
99 -
 100
100 -
 101
101 -
 102
102 -
 103
103 -
 104
104 -
 105
105 -
 106
106 -
 107
107 -
 108
108 -
 109
109 -
 110
110 -
 111
111 -
 112
112 -
 113
113 -
 114
114 -
 115
115 -
116
-
117
-
118
-
119
-
120
-
121
-
122
-
123
-
124
-
125
-
126
-
127
-
128
-
129
-
130
-
131
-
132
-
133
-
134
-
135
-
136
-
137
-
138
-
139
-
140
-
141
-
142
-
143
-
144
-
145
-
146
-
147
-
148
-
149
-
150
-
151
-
152
-
153
-
154
-
155
-
156
-
157
-
158
-
159
-
160
-
161
-
162
-
163
-
164
-
165
-
166
-
167
-
168
-
169
-
170
-
171
-
172
-
173
-
174
-
175
-
176
-
177
-
178
-
179
-
180
-
181
-
182
-
183
-
184
-
185
-
186
-
187
-
188
-
189
-
190
-
191
-
192
-
193
-
194
-
195
-
196
-
197
-
198
-
199
-
200
-
201
-
202
-
203
-
204
-
205
-
206
-
207
-
208
-
209
-
210
-
211
-
212
-
213
-
214
-
215
-
216
-
217
-
218
-
219
-
220
 |
 |

F27
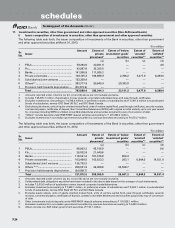
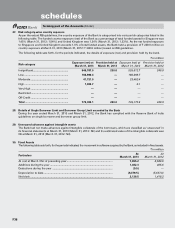
The Bank has exposure in credit derivative instruments including credit default swaps (CDS), credit linked notes,
collateralised debt obligations and principal protected structures. The notional principal amount of these credit derivatives
outstanding at March 31, 2013 was Nil (March 31, 2012: Nil) in funded instrument and ` 3,065.6 million (March 31, 2012:
` 10,349.9 million) in non-funded instruments. The profit and loss impact on the above portfolio on account of mark-to-
market and realised gain/losses during the year ended March 31, 2013 was net profit of ` 75.0 million (March 31, 2012:
net profit ` 561.0 million). At March 31, 2013, the total outstanding mark-to-market position of the above portfolio was
a net gain of ` 10.8 million (March 31, 2012: net loss of ` 59.6 million). Non Rupee denominated credit derivatives are
marked to market by the Bank based on counter-party valuation quotes, or internal models using inputs from market
sources such as Bloomberg/Reuters, counter-parties and FIMMDA. Rupee denominated credit derivatives are marked to
market by the Bank based on FIMMDA guidelines.
The Bank offers deposits to customers of its offshore branches with structured returns linked to interest, forex, credit or
equity benchmarks. The Bank covers these exposures in the inter-bank market. At March 31, 2013, the net open position
on this portfolio was Nil (March 31, 2012: Nil) with mark-to-market position of ` 13.9 million (March 31, 2012: ` 24.8
million). The profit and loss impact on account of mark-to-market and realised profit and loss during the year ended
March 31, 2013 was a net loss of ` 18.7 million (March 31, 2012: net loss of ` 5.2 million).
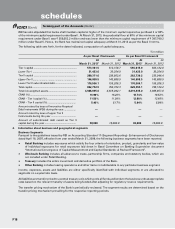
The notional principal amount of forex contracts classified as non-trading at March 31, 2013 amounted to ` 526,615.8
million (March 31, 2012: ` 745,722.2 million). For these non-trading forex contracts, at March 31, 2013, marked to market
position was asset of ` 2,855.4 million (March 31, 2012: ` 22,528.9 million) and liability of ` 6,652.4 million (March 31,
2012: ` 12,843.6 million), credit exposure of ` 16,131.9 million (March 31, 2012: ` 42,639.4 million) and likely impact of
one percentage change in interest rate (100*PV01) was ` 52.3 million (March 31, 2012: ` 81.6 million).
The notional principal amount of forex contracts classified as trading at March 31, 2013 amounted to ` 2,311,888.1
million (March 31, 2012: ` 2,814,328.7 million). For these trading forex contracts, at March 31, 2013, marked to market
position was asset of ` 38,526.6 million (March 31, 2012: ` 70,164.7 million) and liability of ` 32,462.9 million (March 31,
2012: ` 66,449.6 million), credit exposure of ` 97,274.0 million (March 31, 2012: ` 135,371.9 million) and likely impact of
one percentage change in interest rate (100*PV01) was ` 58.9 million (March 31, 2012: ` 90.1 million). The net overnight
open position at March 31, 2013 was ` 573.8 million (March 31, 2012: ` 299.1 million).
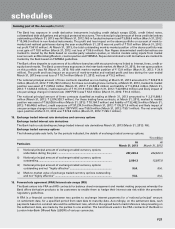
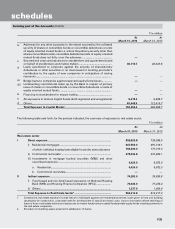
15. Exchange traded interest rate derivatives and currency options
Exchange traded interest rate derivatives
The Bank had no outstanding exchange traded interest rate derivatives March 31, 2013 (March 31, 2012: Nil).
Exchange traded currency options
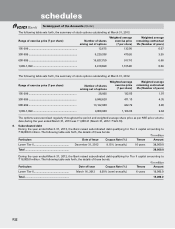
The following table sets forth, for the periods indicated, the details of exchange traded currency options.
` in million
Particulars At
March 31, 2013
At
March 31, 2012
i) Notional principal amount of exchange traded currency options
undertaken during the year ........................................................................... 257,249.4 434,623.3
ii) Notional principal amount of exchange traded currency options
outstanding .................................................................................................... 2,084.3 12,587.8
iii) Notional principal amount of exchange traded currency options
outstanding and not “highly effective” ......................................................... N.A. N.A.
iv) Mark-to-market value of exchange traded currency options outstanding
and not “highly effective” ............................................................................. N.A. N.A.
16. Forward rate agreement (FRA)/Interest rate swaps (IRS)
The Bank enters into FRA and IRS contracts for balance sheet management and market making purposes whereby the
Bank offers derivative products to its customers to enable them to hedge their interest rate risk within the prevalent
regulatory guidelines.
A FRA is a financial contract between two parties to exchange interest payments for a ’notional principal’ amount
on settlement date, for a specified period from start date to maturity date. Accordingly, on the settlement date, cash
payments based on contract rate and the settlement rate, which is the agreed bench-mark/reference rate prevailing on
the settlement date, are made by the parties to one another. The benchmark used in the FRA contracts of the Bank is
London Inter-Bank Offered Rate (LIBOR) of various currencies.
forming part of the Accounts (Contd.)
schedules