ICICI Bank 2013 Annual Report Download - page 70
Download and view the complete annual report
Please find page 70 of the 2013 ICICI Bank annual report below. You can navigate through the pages in the report by either clicking on the pages listed below, or by using the keyword search tool below to find specific information within the annual report.-
 1
1 -
2
-
3
-
4
-
5
-
6
-
7
-
8
-
9
-
10
-
11
-
12
-
13
-
14
-
15
-
16
-
17
-
18
-
19
-
20
-
21
-
22
-
23
-
24
-
25
-
26
-
27
-
28
-
29
-
30
-
31
-
32
-
33
-
34
-
35
-
36
-
37
-
38
-
39
-
40
-
41
-
42
-
43
-
44
-
45
-
46
-
47
-
48
-
49
-
50
-
51
-
52
-
53
-
54
-
55
-
56
-
57
-
58
-
59
-
 60
60 -
 61
61 -
 62
62 -
 63
63 -
 64
64 -
 65
65 -
 66
66 -
 67
67 -
 68
68 -
 69
69 -
 70
70 -
 71
71 -
 72
72 -
 73
73 -
 74
74 -
 75
75 -
 76
76 -
 77
77 -
 78
78 -
 79
79 -
 80
80 -
81
-
82
-
83
-
84
-
85
-
86
-
87
-
88
-
89
-
90
-
91
-
92
-
93
-
94
-
95
-
96
-
97
-
98
-
99
-
100
-
101
-
102
-
103
-
104
-
105
-
106
-
107
-
108
-
109
-
110
-
111
-
112
-
113
-
114
-
115
-
116
-
117
-
118
-
119
-
120
-
121
-
122
-
123
-
124
-
125
-
126
-
127
-
128
-
129
-
130
-
131
-
132
-
133
-
134
-
135
-
136
-
137
-
138
-
139
-
140
-
141
-
142
-
143
-
144
-
145
-
146
-
147
-
148
-
149
-
150
-
151
-
152
-
153
-
154
-
155
-
156
-
157
-
158
-
159
-
160
-
161
-
162
-
163
-
164
-
165
-
166
-
167
-
168
-
169
-
170
-
171
-
172
-
173
-
174
-
175
-
176
-
177
-
178
-
179
-
180
-
181
-
182
-
183
-
184
-
185
-
186
-
187
-
188
-
189
-
190
-
191
-
192
-
193
-
194
-
195
-
196
-
197
-
198
-
199
-
200
-
201
-
202
-
203
-
204
-
205
-
206
-
207
-
208
-
209
-
210
-
211
-
212
-
213
-
214
-
215
-
216
-
217
-
218
-
219
-
220
 |
 |

68
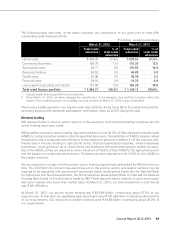
ASSET QUALITY AND COMPOSITION
Loan concentration
We follow a policy of portfolio diversification and evaluate our total financing in a particular sector in light
of our forecasts of growth and profitability for that sector.
Our Credit Risk Management Group monitors all major sectors of the economy and specifically tracks
sectors in which we have loans outstanding. We seek to respond to any economic weakness in an
industrial segment by restricting new exposures to that segment and any growth in an industrial segment
by increasing new exposures to that segment, resulting in active portfolio management.
The following tables set forth, at the dates indicated, the composition of our gross advances (net of
write-offs).
` in billion, except percentages
March 31, 2012 March 31, 2013
Total
advances
% of total
advances
Total
advances
% of total
advances
Retail finance1` 1,028.71 39.3% ` 1,124.11 37.7%
Road, ports, telecom, urban development
and other infrastructure 181.66 6.9 216.91 7.3
Services – non-finance 192.65 7.4 203.52 6.8
Power 141.14 5.4 186.06 6.2
Iron/steel and products 121.59 4.6 161.88 5.4
Services – finance 151.25 5.8 159.62 5.4
Crude petroleum/refining and
petrochemicals 70.68 2.7 88.64 3.0
Mining 84.02 3.2 80.73 2.7
Construction 57.48 2.2 70.51 2.4
Food and beverages 65.71 2.5 69.52 2.3
Cement 39.75 1.5 66.64 2.2
Electronics and engineering 55.80 2.1 66.27 2.2
Wholesale/retail trade 46.29 1.8 55.75 1.9
Shipping 42.35 1.6 45.10 1.5
Metal & products (excluding iron & steel) 48.05 1.8 44.05 1.5
Chemical and fertilizers 34.26 1.3 37.10 1.2
Other industries2259.37 9.9 307.75 10.3
Total ` 2,620.76 100.0% ` 2,984.16 100.0%
1. Includes home loans, commercial business loans, automobile loans, business banking, credit cards, personal
loans, rural loans, loans against securities and dealer financing portfolio.
2. Other industries primarily include developer financing portfolio, automobiles, manufacturing products (excluding
metal), textile, drugs and pharmaceuticals, gems and jewellery and FMCG.
3. From March 31, 2013, we have changed the classification of the domestic loan portfolio to better reflect the
nature of the underlying loans. Accordingly, our loan portfolio at March 31, 2012 is also reclassified.
Management’s Discussion & Analysis