ICICI Bank 2013 Annual Report Download - page 39
Download and view the complete annual report
Please find page 39 of the 2013 ICICI Bank annual report below. You can navigate through the pages in the report by either clicking on the pages listed below, or by using the keyword search tool below to find specific information within the annual report.-
 1
1 -
2
-
3
-
4
-
5
-
6
-
7
-
8
-
9
-
10
-
11
-
12
-
13
-
14
-
15
-
16
-
17
-
18
-
19
-
20
-
21
-
22
-
23
-
24
-
25
-
26
-
27
-
28
-
 29
29 -
 30
30 -
 31
31 -
 32
32 -
 33
33 -
 34
34 -
 35
35 -
 36
36 -
 37
37 -
 38
38 -
 39
39 -
 40
40 -
 41
41 -
 42
42 -
 43
43 -
 44
44 -
 45
45 -
 46
46 -
 47
47 -
 48
48 -
 49
49 -
50
-
51
-
52
-
53
-
54
-
55
-
56
-
57
-
58
-
59
-
60
-
61
-
62
-
63
-
64
-
65
-
66
-
67
-
68
-
69
-
70
-
71
-
72
-
73
-
74
-
75
-
76
-
77
-
78
-
79
-
80
-
81
-
82
-
83
-
84
-
85
-
86
-
87
-
88
-
89
-
90
-
91
-
92
-
93
-
94
-
95
-
96
-
97
-
98
-
99
-
100
-
101
-
102
-
103
-
104
-
105
-
106
-
107
-
108
-
109
-
110
-
111
-
112
-
113
-
114
-
115
-
116
-
117
-
118
-
119
-
120
-
121
-
122
-
123
-
124
-
125
-
126
-
127
-
128
-
129
-
130
-
131
-
132
-
133
-
134
-
135
-
136
-
137
-
138
-
139
-
140
-
141
-
142
-
143
-
144
-
145
-
146
-
147
-
148
-
149
-
150
-
151
-
152
-
153
-
154
-
155
-
156
-
157
-
158
-
159
-
160
-
161
-
162
-
163
-
164
-
165
-
166
-
167
-
168
-
169
-
170
-
171
-
172
-
173
-
174
-
175
-
176
-
177
-
178
-
179
-
180
-
181
-
182
-
183
-
184
-
185
-
186
-
187
-
188
-
189
-
190
-
191
-
192
-
193
-
194
-
195
-
196
-
197
-
198
-
199
-
200
-
201
-
202
-
203
-
204
-
205
-
206
-
207
-
208
-
209
-
210
-
211
-
212
-
213
-
214
-
215
-
216
-
217
-
218
-
219
-
220
 |
 |

Annual Report 2012-2013 37
the highest trading volume in ICICI Bank shares on April 25, 2013. These options would vest over a four
year period, with 20%, 20%, 30% and 30% respectively of the grant of vesting in each year commencing
from the end of 12 months from the date of grant.
Options can be exercised within 10 years from the date of grant or five years from the date of vesting,
whichever is later. The price of the options granted prior to June 30, 2003 is the closing market price
on the stock exchange, which recorded the highest trading volume on the date of grant. The price for
options granted on or after June 30, 2003 till July 21, 2004 is equal to the average of the high and low
market price of the equity shares in the two week period preceding the date of grant of the options, on
the stock exchange which recorded the highest trading volume during the two week period. The price for
options granted on or after July 22, 2004 (other than the grants approved by the Board at its Meeting held
on October 29, 2010 where the grant price was the average closing price of the ICICI Bank stock on the
stock exchange during the six months upto October 28, 2010) is equal to the closing price on the stock
exchange which recorded the highest trading volume preceding the date of grant of options. The above
disclosure is in line with the SEBI guidelines, as amended from time to time.
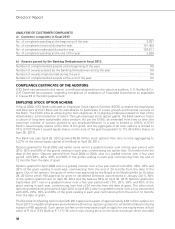
Particulars of options granted by ICICI Bank upto April 26, 2013 are given below:
Options granted till April 26,20131 (excluding options forfeited/lapsed) 60,797,697
Options forfeited/lapsed 10,348,808
Options exercised 30,449,369
Total number of options in force 30,348,328
Options vested 46,657,623
Number of shares allotted pursuant to exercise of options 30,449,369
Extinguishment or modification of options Nil
Amount realised by exercise of options (`)7,621,815,613
1. Includes options granted to wholetime Directors pending RBI approval.
No employee was granted options during any one year equal to or exceeding 0.05% of the issued equity
shares of ICICI Bank at the time of the grant.
The diluted earnings per share (EPS) pursuant to issue of shares on exercise of options calculated in
accordance with AS-20 was ` 71.93 in fiscal 2013 compared to basic EPS of ` 72.20. The Bank recognised
a compensation cost of ` 21.0 million in fiscal 2013 based on the intrinsic value of options. However, if
ICICI Bank had used the fair value of options based on the binomial tree model, compensation cost in
fiscal 2013 would have been higher by ` 1,865.9 million and proforma profit after tax would have been
` 81.39 billion. On a proforma basis, ICICI Bank’s basic and diluted earnings per share would have been
` 70.58 and ` 70.32 respectively.
The key assumptions used to estimate the fair value of options granted during fiscal 2013 are given
below:
Risk-free interest rate 7.99% to 8.87%
Expected life 6.35 years
Expected volatility 48.99% to 49.55%
Expected dividend yield 1.52% to 1.96%
The weighted average fair value of options granted during fiscal 2013 is ` 434.91 (March 31, 2012:
` 592.52).
CONSERVATION OF ENERGY, TECHNOLOGY ABSORPTION, FOREIGN EXCHANGE
EARNINGS AND OUTGO, UNDER SECTION 217(1)(e) OF THE COMPANIES ACT, 1956.
The provisions of Section 217(1)(e) of the Companies Act, 1956 relating to conservation of energy and
technology absorption do not apply to the Bank. The Bank has, however, used information technology
extensively in its operations.