ICICI Bank 2013 Annual Report Download - page 193
Download and view the complete annual report
Please find page 193 of the 2013 ICICI Bank annual report below. You can navigate through the pages in the report by either clicking on the pages listed below, or by using the keyword search tool below to find specific information within the annual report.-
 1
1 -
2
-
3
-
4
-
5
-
6
-
7
-
8
-
9
-
10
-
11
-
12
-
13
-
14
-
15
-
16
-
17
-
18
-
19
-
20
-
21
-
22
-
23
-
24
-
25
-
26
-
27
-
28
-
29
-
30
-
31
-
32
-
33
-
34
-
35
-
36
-
37
-
38
-
39
-
40
-
41
-
42
-
43
-
44
-
45
-
46
-
47
-
48
-
49
-
50
-
51
-
52
-
53
-
54
-
55
-
56
-
57
-
58
-
59
-
60
-
61
-
62
-
63
-
64
-
65
-
66
-
67
-
68
-
69
-
70
-
71
-
72
-
73
-
74
-
75
-
76
-
77
-
78
-
79
-
80
-
81
-
82
-
83
-
84
-
85
-
86
-
87
-
88
-
89
-
90
-
91
-
92
-
93
-
94
-
95
-
96
-
97
-
98
-
99
-
100
-
101
-
102
-
103
-
104
-
105
-
106
-
107
-
108
-
109
-
110
-
111
-
112
-
113
-
114
-
115
-
116
-
117
-
118
-
119
-
120
-
121
-
122
-
123
-
124
-
125
-
126
-
127
-
128
-
129
-
130
-
131
-
132
-
133
-
134
-
135
-
136
-
137
-
138
-
139
-
140
-
141
-
142
-
143
-
144
-
145
-
146
-
147
-
148
-
149
-
150
-
151
-
152
-
153
-
154
-
155
-
156
-
157
-
158
-
159
-
160
-
161
-
162
-
163
-
164
-
165
-
166
-
167
-
168
-
169
-
170
-
171
-
172
-
173
-
174
-
175
-
176
-
177
-
178
-
179
-
180
-
181
-
182
-
 183
183 -
 184
184 -
 185
185 -
 186
186 -
 187
187 -
 188
188 -
 189
189 -
 190
190 -
 191
191 -
 192
192 -
 193
193 -
 194
194 -
 195
195 -
 196
196 -
 197
197 -
 198
198 -
 199
199 -
 200
200 -
 201
201 -
 202
202 -
 203
203 -
204
-
205
-
206
-
207
-
208
-
209
-
210
-
211
-
212
-
213
-
214
-
215
-
216
-
217
-
218
-
219
-
220
 |
 |
F115
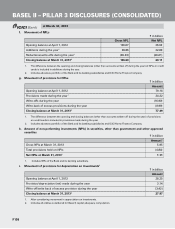
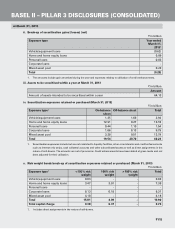
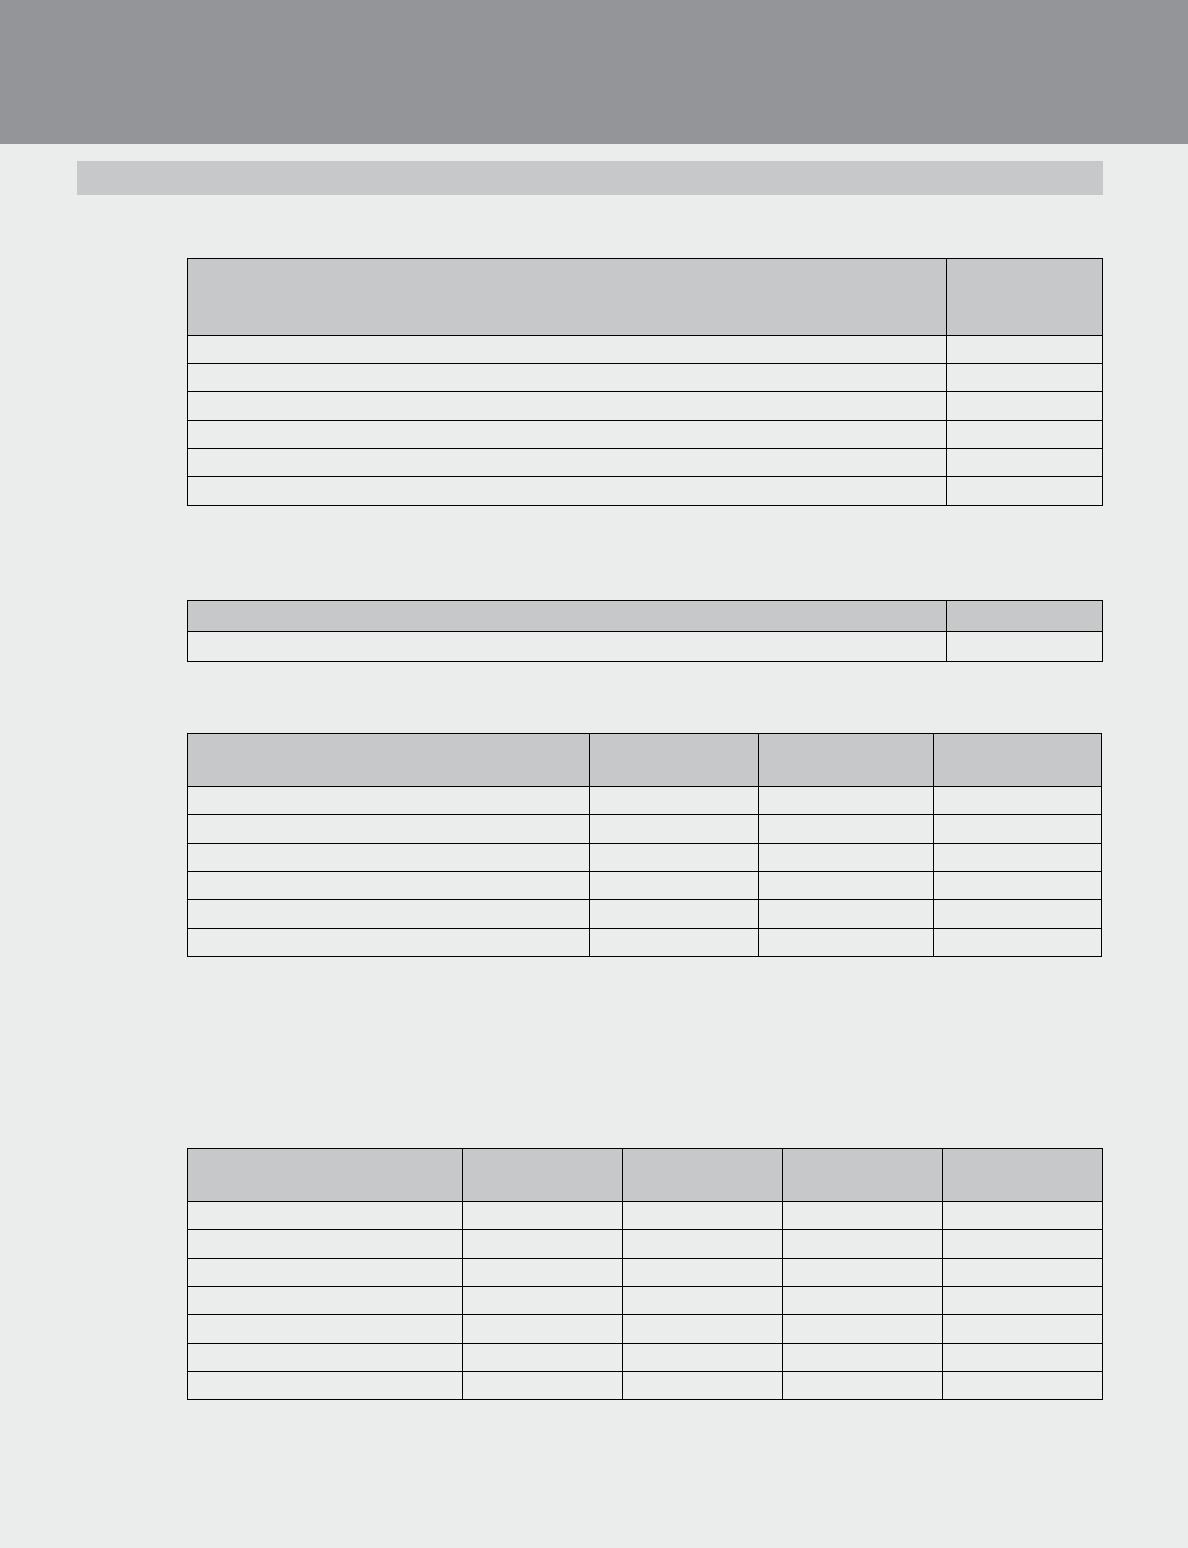
ii. Break-up of securitisation gains/(losses) (net)
` in billion
Exposure type Year ended
March 31,
20131
Vehicle/equipment loans (0.62)
Home and home equity loans 0.09
Personal loans 0.03
Corporate loans -
Mixed asset pool 0.22
Total (0.28)
1. The amounts include gain amortised during the year and expenses relating to utilisation of credit enhancements.
iii. Assets to be securitised within a year at March 31, 2013
` in billion
Amount
Amount of assets intended to be securitised within a year 64.13
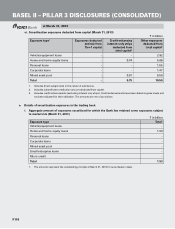
iv. Securitisation exposures retained or purchased (March 31, 2013)
` in billion
Exposure type1On-balance
sheet
Off-balance sheet Total
Vehicle/equipment loans 1.25 1.69 2.94
Home and home equity loans 12.91 0.27 13.18
Personal loans 0.44 1.10 1.54
Corporate loans 1.66 8.13 9.79
Mixed asset pool 3.28 9.51 12.79
Total 19.54 20.70 40.24
1. Securitisation exposures include but are not restricted to liquidity facilities, other commitments and credit enhancements
such as interest only strips, cash collateral accounts and other subordinated assets as well as direct assignments in the
nature of sell-downs. The amounts are net of provisions. Credit enhancements have been stated at gross levels and not
been adjusted for their utilisation.
v. Risk weight bands break-up of securitisation exposures retained or purchased (March 31, 2013)
` in billion
Exposure type1<100% risk
weight
100% risk
weight
>100% risk
weight
Total
Vehicle/equipment loans 0.03 - - 0.03
Home and home equity loans 3.47 3.91 - 7.38
Personal loans - - - -
Corporate loans 8.13 0.18 - 8.31
Mixed asset pool 4.18 - - 4.18
Total 15.81 4.09 - 19.90
Total capital charge 0.38 0.37 - 0.75
1. Includes direct assignments in the nature of sell-downs.
BASEL II – PILLAR 3 DISCLOSURES (CONSOLIDATED)
at March 31, 2013