ICICI Bank 2013 Annual Report Download - page 142
Download and view the complete annual report
Please find page 142 of the 2013 ICICI Bank annual report below. You can navigate through the pages in the report by either clicking on the pages listed below, or by using the keyword search tool below to find specific information within the annual report.-
 1
1 -
2
-
3
-
4
-
5
-
6
-
7
-
8
-
9
-
10
-
11
-
12
-
13
-
14
-
15
-
16
-
17
-
18
-
19
-
20
-
21
-
22
-
23
-
24
-
25
-
26
-
27
-
28
-
29
-
30
-
31
-
32
-
33
-
34
-
35
-
36
-
37
-
38
-
39
-
40
-
41
-
42
-
43
-
44
-
45
-
46
-
47
-
48
-
49
-
50
-
51
-
52
-
53
-
54
-
55
-
56
-
57
-
58
-
59
-
60
-
61
-
62
-
63
-
64
-
65
-
66
-
67
-
68
-
69
-
70
-
71
-
72
-
73
-
74
-
75
-
76
-
77
-
78
-
79
-
80
-
81
-
82
-
83
-
84
-
85
-
86
-
87
-
88
-
89
-
90
-
91
-
92
-
93
-
94
-
95
-
96
-
97
-
98
-
99
-
100
-
101
-
102
-
103
-
104
-
105
-
106
-
107
-
108
-
109
-
110
-
111
-
112
-
113
-
114
-
115
-
116
-
117
-
118
-
119
-
120
-
121
-
122
-
123
-
124
-
125
-
126
-
127
-
128
-
129
-
130
-
131
-
 132
132 -
 133
133 -
 134
134 -
 135
135 -
 136
136 -
 137
137 -
 138
138 -
 139
139 -
 140
140 -
 141
141 -
 142
142 -
 143
143 -
 144
144 -
 145
145 -
 146
146 -
 147
147 -
 148
148 -
 149
149 -
 150
150 -
 151
151 -
 152
152 -
153
-
154
-
155
-
156
-
157
-
158
-
159
-
160
-
161
-
162
-
163
-
164
-
165
-
166
-
167
-
168
-
169
-
170
-
171
-
172
-
173
-
174
-
175
-
176
-
177
-
178
-
179
-
180
-
181
-
182
-
183
-
184
-
185
-
186
-
187
-
188
-
189
-
190
-
191
-
192
-
193
-
194
-
195
-
196
-
197
-
198
-
199
-
200
-
201
-
202
-
203
-
204
-
205
-
206
-
207
-
208
-
209
-
210
-
211
-
212
-
213
-
214
-
215
-
216
-
217
-
218
-
219
-
220
 |
 |
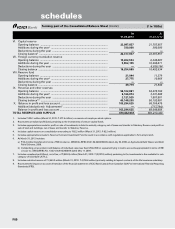
F64
At
31.03.2013
At
31.03.2012
SCHEDULE 10 - FIXED ASSETS
I. Premises
At cost at March 31 of preceding year ......................................................... 46,967,168 45,902,791
Additions during the year ............................................................................. 1,710,528 1,656,184
Deductions during the year .......................................................................... (1,497,657) (591,807)
Depreciation to date1 ..................................................................................... (9,896,489) (9,383,551)
Net block ....................................................................................................... 37,283,550 37,583,617
II. Other fixed assets (including furniture and fixtures)
At cost at March 31 of preceding year ......................................................... 45,135,661 41,441,024
Additions during the year ............................................................................. 5,449,314 4,441,598
Deductions during the year .......................................................................... (2,933,551) (746,961)
Depreciation to date2 ..................................................................................... (32,548,701) (30,793,785)
Net block ....................................................................................................... 15,102,723 14,341,876
III. Assets given on Lease
At cost at March 31 of preceding year .......................................................... 17,509,544 17,510,087
Additions during the year .............................................................................. ——
Deductions during the year ........................................................................... — (543)
Depreciation to date, accumulated lease adjustment and provisions3 ........ (15,161,230) (15,115,215)
Net block ......................................................................................................... 2,348,314 2,394,329
TOTAL FIXED ASSETS ........................................................................................... 54,734,587 54,319,822
1. Includes depreciation charge amounting to ` 1,638.8 million for FY2013 (FY2012: ` 1,863.0 million).
2. Includes depreciation charge amounting to ` 4,590.9 million for FY2013 (FY2012: ` 4,550.2 million).
3. Includes depreciation charge/lease adjustment amounting to ` 328.2 million for FY2013 (FY2012: ` 422.6 million).
SCHEDULE 11 - OTHER ASSETS
I. Inter-office adjustments (net) ....................................................................... ——
II. Interest accrued ............................................................................................ 55,093,457 53,644,915
III. Tax paid in advance/tax deducted at source (net) ...................................... 41,873,082 38,176,875
IV. Stationery and stamps ................................................................................. 10,045 10,308
V. Non-banking assets acquired in satisfaction of claims1 .............................. 576,833 600,575
VI. Advance for capital assets ........................................................................... 1,358,102 1,494,098
VII. Deposits ........................................................................................................ 12,256,273 12,144,123
VIII. Deferred tax asset (net) ................................................................................ 26,805,959 28,033,693
IX. Others2,3 ......................................................................................................... 205,392,184 272,986,573
TOTAL OTHER ASSETS ......................................................................................... 343,365,935 407,091,160
1. Includes certain non-banking assets acquired in satisfaction of claims which are in the process of being transferred in the Bank’s name.
2. Includes goodwill on consolidation amounting to ` 1,432.3 million (March 31, 2012: ` 1,432.3 million).
3. The Bank has presented the mark-to-market (MTM) gain or loss on forex and derivative transactions on gross basis. Accordingly, the gross positive
MTM of the Bank amounting to ` 113,239.6 million has been included in Other assets. Consequent to the change, Other assets have increased
by ` 150,954.8 million at March 31, 2012.
SCHEDULE 12 - CONTINGENT LIABILITIES
I. Claims against the Group not acknowledged as debts ................................ 53,721,418 34,360,751
II. Liability for partly paid investments .............................................................. 128,050 128,050
III. Liability on account of outstanding forward exchange contracts1 ............... 2,984,263,552 3,672,103,795
IV. Guarantees given on behalf of constituents .................................................
a) In India ....................................................................................................... 718,450,966 721,472,153
b) Outside India .............................................................................................. 235,173,947 243,307,639
V. Acceptances, endorsements and other obligations ..................................... 623,110,066 569,297,814
VI. Currency swaps1 ............................................................................................. 563,086,874 629,205,403
VII. Interest rate swaps, currency options and interest rate futures1 ................. 3,924,345,424 4,441,277,345
VIII. Other items for which the Group is contingently liable ............................... 37,431,907 64,438,333
TOTAL CONTINGENT LIABILITIES ........................................................................ 9,139,712,204 10,375,591,283
1. Represents notional amount.
forming part of the Consolidated Balance Sheet (Contd.) (` in ‘000s)
schedules