ICICI Bank 2013 Annual Report Download - page 54
Download and view the complete annual report
Please find page 54 of the 2013 ICICI Bank annual report below. You can navigate through the pages in the report by either clicking on the pages listed below, or by using the keyword search tool below to find specific information within the annual report.-
 1
1 -
2
-
3
-
4
-
5
-
6
-
7
-
8
-
9
-
10
-
11
-
12
-
13
-
14
-
15
-
16
-
17
-
18
-
19
-
20
-
21
-
22
-
23
-
24
-
25
-
26
-
27
-
28
-
29
-
30
-
31
-
32
-
33
-
34
-
35
-
36
-
37
-
38
-
39
-
40
-
41
-
42
-
43
-
 44
44 -
 45
45 -
 46
46 -
 47
47 -
 48
48 -
 49
49 -
 50
50 -
 51
51 -
 52
52 -
 53
53 -
 54
54 -
 55
55 -
 56
56 -
 57
57 -
 58
58 -
 59
59 -
 60
60 -
 61
61 -
 62
62 -
 63
63 -
 64
64 -
65
-
66
-
67
-
68
-
69
-
70
-
71
-
72
-
73
-
74
-
75
-
76
-
77
-
78
-
79
-
80
-
81
-
82
-
83
-
84
-
85
-
86
-
87
-
88
-
89
-
90
-
91
-
92
-
93
-
94
-
95
-
96
-
97
-
98
-
99
-
100
-
101
-
102
-
103
-
104
-
105
-
106
-
107
-
108
-
109
-
110
-
111
-
112
-
113
-
114
-
115
-
116
-
117
-
118
-
119
-
120
-
121
-
122
-
123
-
124
-
125
-
126
-
127
-
128
-
129
-
130
-
131
-
132
-
133
-
134
-
135
-
136
-
137
-
138
-
139
-
140
-
141
-
142
-
143
-
144
-
145
-
146
-
147
-
148
-
149
-
150
-
151
-
152
-
153
-
154
-
155
-
156
-
157
-
158
-
159
-
160
-
161
-
162
-
163
-
164
-
165
-
166
-
167
-
168
-
169
-
170
-
171
-
172
-
173
-
174
-
175
-
176
-
177
-
178
-
179
-
180
-
181
-
182
-
183
-
184
-
185
-
186
-
187
-
188
-
189
-
190
-
191
-
192
-
193
-
194
-
195
-
196
-
197
-
198
-
199
-
200
-
201
-
202
-
203
-
204
-
205
-
206
-
207
-
208
-
209
-
210
-
211
-
212
-
213
-
214
-
215
-
216
-
217
-
218
-
219
-
220
 |
 |

52
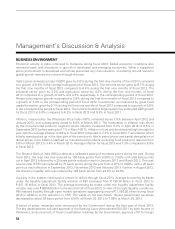
BUSINESS ENVIRONMENT
Economic activity in India continued to moderate during fiscal 2013. Global economic conditions also
remained weak with slowdown in growth in developed and emerging economies. While a supportive
policy environment in developed economies prevented any crisis situation, uncertainty around revival in
global growth remained a concern through the year.
India’s gross domestic product (GDP) grew by 5.0% during the first nine months of fiscal 2013 compared
to a growth of 6.6% in the corresponding period of fiscal 2012. The services sector grew by 6.7% during
the first nine months of fiscal 2013 compared to 8.5% during the first nine months of fiscal 2012. The
industrial sector grew by 3.2% and agriculture sector by 4.0% during the first nine months of fiscal
2013 compared to a growth of 4.0% and 4.3% respectively in the corresponding period of fiscal 2012.
Private consumption growth moderated to 2.9% during the first nine months of fiscal 2013 compared to
a growth of 7.4% in the corresponding period of fiscal 2012. Investments, as measured by gross fixed
capital formation, grew by 0.1% during the first nine months of fiscal 2013 compared to a growth of 5.0%
in the corresponding period of fiscal 2012. The Central Statistical Organisation has estimated GDP growth
for fiscal 2013 at 5.0% compared to 6.2% in fiscal 2012 and 9.3% in fiscal 2011.
Inflation, measured by the Wholesale Price Index (WPI), remained above 7.0% between April 2012 and
January 2013, and subsequently eased to 6.0% in March 2013. The moderation in inflation was driven
by the manufactured products segment where inflation increased from 5.3% in April 2012 to 6.5% in
September 2012 before easing to 4.1% in March 2013. Inflation in food articles remained high through the
year with the average inflation at 9.9% in fiscal 2013 compared to 7.3% in fiscal 2012. Fuel inflation which
initially eased picked up in the later part of the year due to hike in petrol prices and partial deregulation of
diesel prices. Core inflation (defined as manufactured products excluding food products) reduced from
5.0% in March 2012 to 3.4% in March 2013. Average inflation for fiscal 2013 was 7.3% compared to 8.9%
in fiscal 2012.
The Reserve Bank of India (RBI) undertook a calibrated easing of monetary policy during the year. During
fiscal 2013, the repo rate was reduced by 100 basis points from 8.50% to 7.50% with a 50 basis points
cut in April 2012 followed by a 25 basis points reduction each in January 2013 and March 2013. The cash
reserve ratio (CRR) was reduced by 75 basis points during the year from 4.75% to 4.00%, with a 25 basis
point cut each effective in September 2012, November 2012 and February 2013. Further, in August 2012,
the statutory liquidity ratio was reduced by 100 basis points from 24.0% to 23.0%.
Liquidity in the system continued to remain in deficit through fiscal 2013. Average borrowing by banks
under the liquidity adjustment facility window of RBI increased from ` 798.78 billion in fiscal 2012 to
` 841.16 billion in fiscal 2013. The average borrowing by banks under the liquidity adjustment facility
window was over ` 960.00 billion in the second half of fiscal 2013. In view of the tight liquidity conditions,
RBI injected liquidity through open market operations aggregating around ` 1,550.00 billion during fiscal
2013 in addition to the reduction in CRR. The yields on the benchmark 10-year government securities
decreased by about 58 basis points from 8.54% at March 30, 2012 to 7.96% at March 28, 2013.
A series of policy measures were announced by the Government during the later part of fiscal 2013.
The key developments included approval of the Banking Laws (Amendment) Bill 2011 by both houses of
Parliament, announcement of fiscal consolidation roadmap by the Government, approval of 51% foreign
Management’s Discussion & Analysis