ICICI Bank 2013 Annual Report Download - page 73
Download and view the complete annual report
Please find page 73 of the 2013 ICICI Bank annual report below. You can navigate through the pages in the report by either clicking on the pages listed below, or by using the keyword search tool below to find specific information within the annual report.-
 1
1 -
2
-
3
-
4
-
5
-
6
-
7
-
8
-
9
-
10
-
11
-
12
-
13
-
14
-
15
-
16
-
17
-
18
-
19
-
20
-
21
-
22
-
23
-
24
-
25
-
26
-
27
-
28
-
29
-
30
-
31
-
32
-
33
-
34
-
35
-
36
-
37
-
38
-
39
-
40
-
41
-
42
-
43
-
44
-
45
-
46
-
47
-
48
-
49
-
50
-
51
-
52
-
53
-
54
-
55
-
56
-
57
-
58
-
59
-
60
-
61
-
62
-
 63
63 -
 64
64 -
 65
65 -
 66
66 -
 67
67 -
 68
68 -
 69
69 -
 70
70 -
 71
71 -
 72
72 -
 73
73 -
 74
74 -
 75
75 -
 76
76 -
 77
77 -
 78
78 -
 79
79 -
 80
80 -
 81
81 -
 82
82 -
 83
83 -
84
-
85
-
86
-
87
-
88
-
89
-
90
-
91
-
92
-
93
-
94
-
95
-
96
-
97
-
98
-
99
-
100
-
101
-
102
-
103
-
104
-
105
-
106
-
107
-
108
-
109
-
110
-
111
-
112
-
113
-
114
-
115
-
116
-
117
-
118
-
119
-
120
-
121
-
122
-
123
-
124
-
125
-
126
-
127
-
128
-
129
-
130
-
131
-
132
-
133
-
134
-
135
-
136
-
137
-
138
-
139
-
140
-
141
-
142
-
143
-
144
-
145
-
146
-
147
-
148
-
149
-
150
-
151
-
152
-
153
-
154
-
155
-
156
-
157
-
158
-
159
-
160
-
161
-
162
-
163
-
164
-
165
-
166
-
167
-
168
-
169
-
170
-
171
-
172
-
173
-
174
-
175
-
176
-
177
-
178
-
179
-
180
-
181
-
182
-
183
-
184
-
185
-
186
-
187
-
188
-
189
-
190
-
191
-
192
-
193
-
194
-
195
-
196
-
197
-
198
-
199
-
200
-
201
-
202
-
203
-
204
-
205
-
206
-
207
-
208
-
209
-
210
-
211
-
212
-
213
-
214
-
215
-
216
-
217
-
218
-
219
-
220
 |
 |
Annual Report 2012-2013 71
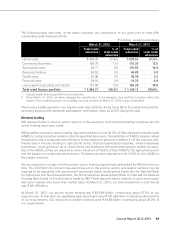
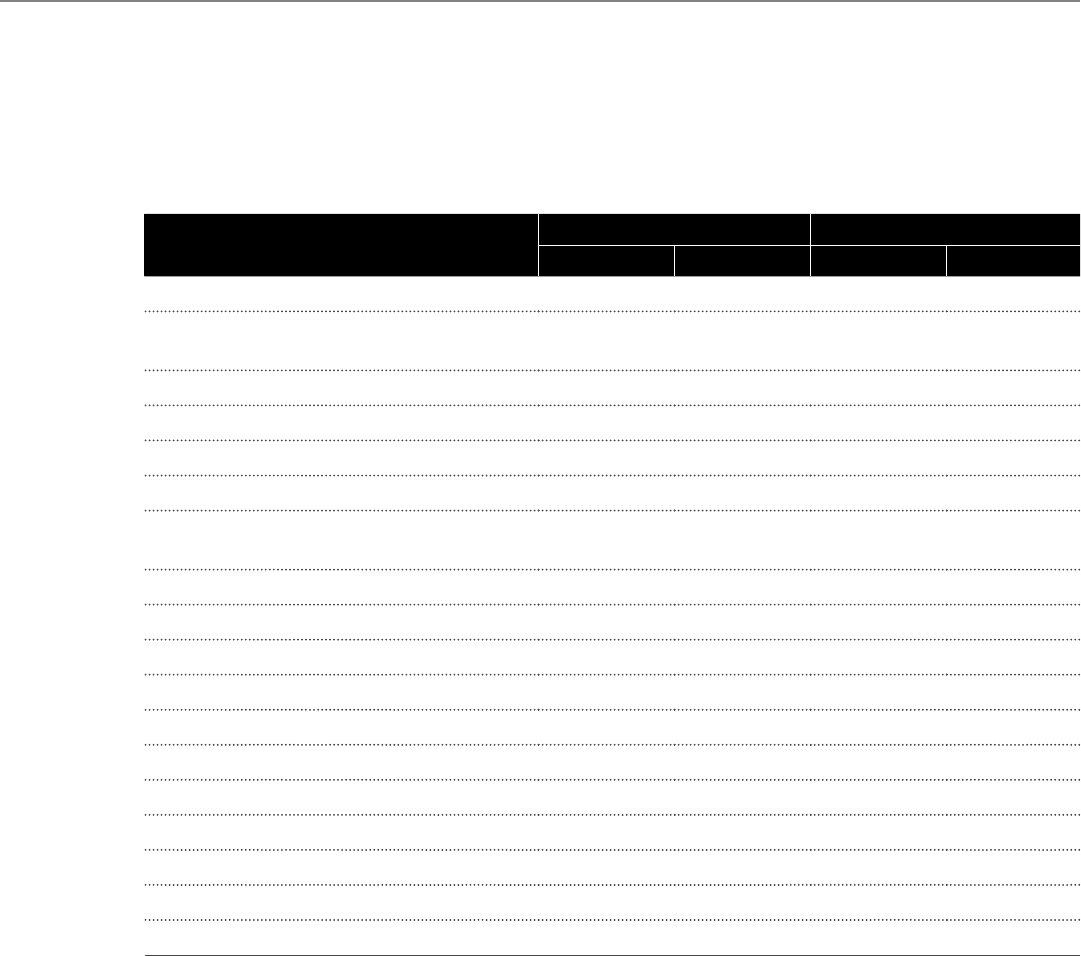
The following table sets forth, at March 31, 2012 and March 31, 2013, the composition of gross non-
performing assets by industry sector.
` in billion, except percentages
March 31, 2012 March 31, 2013
Amount % Amount %
Retail finance1` 76.73 80.2% ` 58.14 60.3%
Road, ports, telecom, urban development
and other infrastructure 0.15 0.2 0.14 0.1
Services – non-finance 0.37 0.4 8.77 9.1
Power 0.09 0.1 0.09 0.1
Iron/steel and products 0.91 0.9 1.99 2.1
Services – finance 0.00 0.0 0.00 0.0
Crude petroleum/refining and
petrochemicals 0.05 0.0 0.04 0.0
Mining 0.00 0.0 0.20 0.2
Construction 0.89 0.9 2.24 2.3
Food and beverages 1.54 1.6 1.94 2.0
Cement - - - -
Electronics and engineering 1.81 1.9 2.59 2.7
Wholesale/retail trade 1.15 1.2 4.16 4.3
Shipping 0.45 0.5 0.38 0.4
Metal & products (excluding iron & steel) 1.11 1.2 1.06 1.1
Chemical and fertilizers 1.52 1.6 1.33 1.4
Other industries2 8.86 9.3 13.40 13.9
Total ` 95.63 100.0% ` 96.47 100.0%
1. Includes home loans, commercial business loans, automobile loans, business banking, credit cards, personal
loans, rural loans, loans against securities and dealer financing portfolio.
2. Other industries primarily include developer financing portfolio, automobiles, manufacturing products (excluding
metal), textile, drugs and pharmaceuticals, gems and jewellery and FMCG.
3. From March 31, 2013, we have changed the classification of the domestic loan portfolio to better reflect the
nature of the underlying loans. Accordingly, our loan portfolio at March 31, 2012 has also been reclassified.
At March 31, 2013, the net non-performing loans in the retail portfolio were 0.72% of net retail loans as
compared with 1.22% at March 31, 2012. The decrease in the ratio was primarily on account of sharp
decline in accretion to retail NPAs.
Our aggregate investments in security receipts issued by asset reconstruction companies were ` 11.47
billion at March 31, 2013 as compared to ` 18.32 billion at March 31, 2012.
RBI has issued guidelines revising the format of disclosures on restructured loans. The revised format
requires banks to disclose the movement of the borrower level outstanding of borrowers whose
loans were restructured. During fiscal 2013, standard loans of ` 16.78 billion of 23 borrowers were