ICICI Bank 2013 Annual Report Download - page 111
Download and view the complete annual report
Please find page 111 of the 2013 ICICI Bank annual report below. You can navigate through the pages in the report by either clicking on the pages listed below, or by using the keyword search tool below to find specific information within the annual report.-
 1
1 -
2
-
3
-
4
-
5
-
6
-
7
-
8
-
9
-
10
-
11
-
12
-
13
-
14
-
15
-
16
-
17
-
18
-
19
-
20
-
21
-
22
-
23
-
24
-
25
-
26
-
27
-
28
-
29
-
30
-
31
-
32
-
33
-
34
-
35
-
36
-
37
-
38
-
39
-
40
-
41
-
42
-
43
-
44
-
45
-
46
-
47
-
48
-
49
-
50
-
51
-
52
-
53
-
54
-
55
-
56
-
57
-
58
-
59
-
60
-
61
-
62
-
63
-
64
-
65
-
66
-
67
-
68
-
69
-
70
-
71
-
72
-
73
-
74
-
75
-
76
-
77
-
78
-
79
-
80
-
81
-
82
-
83
-
84
-
85
-
86
-
87
-
88
-
89
-
90
-
91
-
92
-
93
-
94
-
95
-
96
-
97
-
98
-
99
-
100
-
 101
101 -
 102
102 -
 103
103 -
 104
104 -
 105
105 -
 106
106 -
 107
107 -
 108
108 -
 109
109 -
 110
110 -
 111
111 -
 112
112 -
 113
113 -
 114
114 -
 115
115 -
 116
116 -
 117
117 -
 118
118 -
 119
119 -
 120
120 -
 121
121 -
122
-
123
-
124
-
125
-
126
-
127
-
128
-
129
-
130
-
131
-
132
-
133
-
134
-
135
-
136
-
137
-
138
-
139
-
140
-
141
-
142
-
143
-
144
-
145
-
146
-
147
-
148
-
149
-
150
-
151
-
152
-
153
-
154
-
155
-
156
-
157
-
158
-
159
-
160
-
161
-
162
-
163
-
164
-
165
-
166
-
167
-
168
-
169
-
170
-
171
-
172
-
173
-
174
-
175
-
176
-
177
-
178
-
179
-
180
-
181
-
182
-
183
-
184
-
185
-
186
-
187
-
188
-
189
-
190
-
191
-
192
-
193
-
194
-
195
-
196
-
197
-
198
-
199
-
200
-
201
-
202
-
203
-
204
-
205
-
206
-
207
-
208
-
209
-
210
-
211
-
212
-
213
-
214
-
215
-
216
-
217
-
218
-
219
-
220
 |
 |

F33
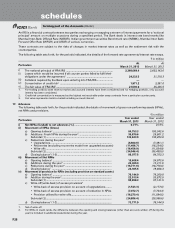
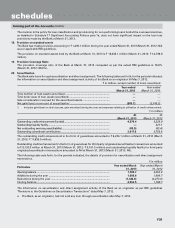
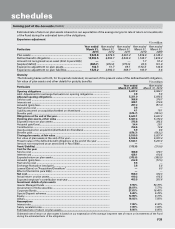
24. Floating provision
Bank holds floating provision of ` 1.9 million at March 31, 2013 (March 31, 2012: ` 1.9 million) taken over from erstwhile
Bank of Rajasthan on amalgamation.
25. Concentration of Deposits, Advances, Exposures and NPAs
(I) Concentration of deposits, advances, exposures and NPAs
` in million
Concentration of deposits
At
March 31, 2013
At
March 31, 2012
Total deposits of twenty largest depositors ............................................... 280,257.1 212,175.1
Deposits of twenty largest depositors as a percentage of total deposits
of the Bank ................................................................................................... 9.58% 8.30%
` in million
Concentration of advances1
At
March 31, 2013
At
March 31, 2012
Total advances to twenty largest borrowers (including banks) ................ 1,095,316.4 1,032,621.4
Advances to twenty largest borrowers as a percentage of total advances
of the Bank .................................................................................................. 15.44% 15.40%
1. Represents credit exposure (funded and non-funded) including derivatives exposures as per RBI guidelines on exposure
norms.
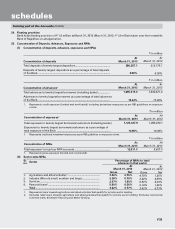
` in million
Concentration of exposures1At
March 31, 2013
At
March 31, 2012
Total exposure to twenty largest borrowers/customers (including banks) 1,126,427.8 1,066,030.1
Exposures to twenty largest borrowers/customers as a percentage of
total exposure of the Bank ......................................................................... 14.85% 14.94%
1. Represents credit and investment exposures as per RBI guidelines on exposure norms.
` in million
Concentration of NPAs At
March 31, 2013
At
March 31, 2012
Total exposure1 to top four NPA accounts ................................................. 12,511.3 5,657.3
1. Represents gross exposure (funded and non-funded).
(II) Sector-wise NPAs
Sr.
no. Sector Percentage of NPAs to total
advances in that sector
At
March 31, 2013 At
March 31, 2012
Gross Net Gross Net
1. Agriculture and allied activities1 ........................................... 3.60% 0.75% 4.78% 1.25%
2. Industry (Micro & small, medium and large) ........................ 2.28% 0.70% 2.02% 0.69%
3. Services ................................................................................. 2.47% 1.05% 0.92% 0.24%
4. Personal loans2 ...................................................................... 5.80% 0.56% 9.18% 1.26%
Total ....................................................................................... 3.22% 0.77% 3.62% 0.73%
1. Represents loans towards agriculture and allied activities that qualify for priority sector lending.
2. Excludes retail loans towards agriculture and allied activities that qualify for priority sector lending. Excludes commercial
business loans, developer financing and dealer funding.
forming part of the Accounts (Contd.)
schedules