ICICI Bank 2013 Annual Report Download - page 108
Download and view the complete annual report
Please find page 108 of the 2013 ICICI Bank annual report below. You can navigate through the pages in the report by either clicking on the pages listed below, or by using the keyword search tool below to find specific information within the annual report.-
 1
1 -
2
-
3
-
4
-
5
-
6
-
7
-
8
-
9
-
10
-
11
-
12
-
13
-
14
-
15
-
16
-
17
-
18
-
19
-
20
-
21
-
22
-
23
-
24
-
25
-
26
-
27
-
28
-
29
-
30
-
31
-
32
-
33
-
34
-
35
-
36
-
37
-
38
-
39
-
40
-
41
-
42
-
43
-
44
-
45
-
46
-
47
-
48
-
49
-
50
-
51
-
52
-
53
-
54
-
55
-
56
-
57
-
58
-
59
-
60
-
61
-
62
-
63
-
64
-
65
-
66
-
67
-
68
-
69
-
70
-
71
-
72
-
73
-
74
-
75
-
76
-
77
-
78
-
79
-
80
-
81
-
82
-
83
-
84
-
85
-
86
-
87
-
88
-
89
-
90
-
91
-
92
-
93
-
94
-
95
-
96
-
97
-
 98
98 -
 99
99 -
 100
100 -
 101
101 -
 102
102 -
 103
103 -
 104
104 -
 105
105 -
 106
106 -
 107
107 -
 108
108 -
 109
109 -
 110
110 -
 111
111 -
 112
112 -
 113
113 -
 114
114 -
 115
115 -
 116
116 -
 117
117 -
 118
118 -
119
-
120
-
121
-
122
-
123
-
124
-
125
-
126
-
127
-
128
-
129
-
130
-
131
-
132
-
133
-
134
-
135
-
136
-
137
-
138
-
139
-
140
-
141
-
142
-
143
-
144
-
145
-
146
-
147
-
148
-
149
-
150
-
151
-
152
-
153
-
154
-
155
-
156
-
157
-
158
-
159
-
160
-
161
-
162
-
163
-
164
-
165
-
166
-
167
-
168
-
169
-
170
-
171
-
172
-
173
-
174
-
175
-
176
-
177
-
178
-
179
-
180
-
181
-
182
-
183
-
184
-
185
-
186
-
187
-
188
-
189
-
190
-
191
-
192
-
193
-
194
-
195
-
196
-
197
-
198
-
199
-
200
-
201
-
202
-
203
-
204
-
205
-
206
-
207
-
208
-
209
-
210
-
211
-
212
-
213
-
214
-
215
-
216
-
217
-
218
-
219
-
220
 |
 |

F30
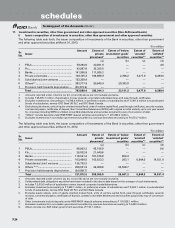
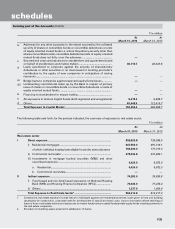
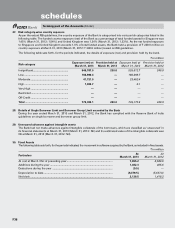
b. The following table sets forth, for the period indicated, the information on the loans sold through direct assignment after
May 7, 2012.
` in million
Particulars At
March 31, 2013
Total amount of assets sold through direct assignment during the year ended March 31, 2013 731.3
Total amount of exposures retained by the Bank to comply with
Minimum Retention Requirement (MRR)
a) Off-balance sheet exposures
•Firstloss ...........................................................................................................
•Others ..............................................................................................................
—
—
b) On-balance sheet exposures
•Firstloss ...........................................................................................................
•Others ..............................................................................................................
—
73.1
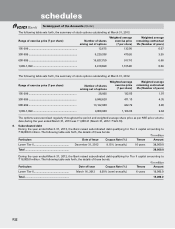
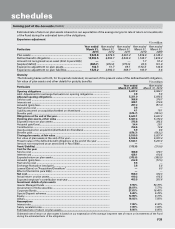
21. Financial assets transferred during the year to securitisation company (SC)/reconstruction company (RC)
The Bank has transferred certain assets to Asset Reconstruction Companies (ARCs) in terms of the guidelines issued by
RBI governing such transfer. For the purpose of the valuation of the underlying security receipts issued by the underlying
trusts managed by ARCs, the security receipts are valued at their respective NAVs as advised by the ARCs.
The following table sets forth, for the periods indicated, the details of the assets transferred.
` in million, except number of accounts
Year ended
March 31, 2013
Year ended
March 31, 2012
Number of accounts1............................................................................................ 42
Aggregate value (net of provisions) of accounts sold to SC/RC ........................ 82.9 44.4
Aggregate consideration ...................................................................................... 116.5 94.1
Additional consideration realised in respect of accounts transferred in earlier years2——
Aggregate gain/(loss) over net book value ......................................................... 33.6 49.7
1. Excludes accounts previously written-off.
2. During the year ended March 31, 2013, asset reconstruction companies have not fully redeemed any of the security receipts.
Gain/loss during the year ended March 31, 2013 amounted to Nil (March 31, 2012: net loss of ` 950.6 million).
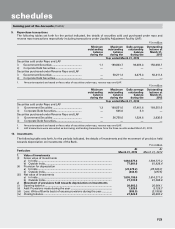
22. Details of non-performing assets purchased/sold, excluding those sold to SC/RC
The Bank has not purchased any non-performing assets in terms of the guidelines issued by the RBI circular no. DBOD.
No.BP.BC.16/21.04.048/2005-06 dated July 13, 2005. The Bank has sold certain non-performing assets in terms of the
above RBI guidelines.
The following table sets forth, for the periods indicated, details of non-performing assets sold, excluding those sold to
SC/RC.
` in million, except number of accounts
Year ended
March 31, 2013
Year ended
March 31, 2012
No. of accounts .................................................................................................... 21
Aggregate value (net of provisions) of accounts sold, excluding those sold to SC/RC
78.8 642.0
Aggregate consideration ...................................................................................... 100.1 641.0
Aggregate gain/(loss) over net book value ......................................................... 21.3 (1.0)
forming part of the Accounts (Contd.)
schedules