ICICI Bank 2013 Annual Report Download - page 58
Download and view the complete annual report
Please find page 58 of the 2013 ICICI Bank annual report below. You can navigate through the pages in the report by either clicking on the pages listed below, or by using the keyword search tool below to find specific information within the annual report.-
 1
1 -
2
-
3
-
4
-
5
-
6
-
7
-
8
-
9
-
10
-
11
-
12
-
13
-
14
-
15
-
16
-
17
-
18
-
19
-
20
-
21
-
22
-
23
-
24
-
25
-
26
-
27
-
28
-
29
-
30
-
31
-
32
-
33
-
34
-
35
-
36
-
37
-
38
-
39
-
40
-
41
-
42
-
43
-
44
-
45
-
46
-
47
-
 48
48 -
 49
49 -
 50
50 -
 51
51 -
 52
52 -
 53
53 -
 54
54 -
 55
55 -
 56
56 -
 57
57 -
 58
58 -
 59
59 -
 60
60 -
 61
61 -
 62
62 -
 63
63 -
 64
64 -
 65
65 -
 66
66 -
 67
67 -
 68
68 -
69
-
70
-
71
-
72
-
73
-
74
-
75
-
76
-
77
-
78
-
79
-
80
-
81
-
82
-
83
-
84
-
85
-
86
-
87
-
88
-
89
-
90
-
91
-
92
-
93
-
94
-
95
-
96
-
97
-
98
-
99
-
100
-
101
-
102
-
103
-
104
-
105
-
106
-
107
-
108
-
109
-
110
-
111
-
112
-
113
-
114
-
115
-
116
-
117
-
118
-
119
-
120
-
121
-
122
-
123
-
124
-
125
-
126
-
127
-
128
-
129
-
130
-
131
-
132
-
133
-
134
-
135
-
136
-
137
-
138
-
139
-
140
-
141
-
142
-
143
-
144
-
145
-
146
-
147
-
148
-
149
-
150
-
151
-
152
-
153
-
154
-
155
-
156
-
157
-
158
-
159
-
160
-
161
-
162
-
163
-
164
-
165
-
166
-
167
-
168
-
169
-
170
-
171
-
172
-
173
-
174
-
175
-
176
-
177
-
178
-
179
-
180
-
181
-
182
-
183
-
184
-
185
-
186
-
187
-
188
-
189
-
190
-
191
-
192
-
193
-
194
-
195
-
196
-
197
-
198
-
199
-
200
-
201
-
202
-
203
-
204
-
205
-
206
-
207
-
208
-
209
-
210
-
211
-
212
-
213
-
214
-
215
-
216
-
217
-
218
-
219
-
220
 |
 |

56
The total capital adequacy ratio of ICICI Bank on a standalone basis at March 31, 2013 in accordance with
RBI guidelines on Basel II was 18.74% with a Tier-1 capital adequacy ratio of 12.80% compared to a total
capital adequacy ratio of 18.52% and Tier-1 capital adequacy ratio of 12.68% at March 31, 2012.
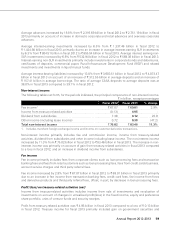
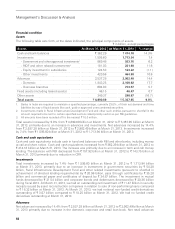
Operating results data
The following table sets forth, for the periods indicated, the operating results data.
` in billion, except percentages
Particulars Fiscal 2012 Fiscal 2013 % change
Interest income ` 335.42 ` 400.75 19.5%
Interest expense 228.08 262.09 14.9
Net interest income 107.34 138.66 29.2
Non-interest income
- Fee income167.07 69.01 2.9
- Treasury income (0.13) 4.95 -
- Dividend from subsidiaries 7.36 9.12 23.9
- Other income (including lease income) 0.72 0.38 (47.2)
Operating income 182.36 222.12 21.8
Operating expenses278.50 90.13 14.8
Operating profit 103.86 131.99 27.1
Provisions, net of write-backs 15.83 18.03 13.9
Profit before tax 88.03 113.96 29.5
Tax, including deferred tax 23.38 30.71 31.4
Profit after tax ` 64.65 ` 83.25 28.8%
1. Includes merchant foreign exchange income and margin on customer derivative transactions.
2. Operating expenses include lease depreciation and direct marketing agency expenses.
3. All amounts have been rounded off to the nearest ` 10.0 million.
4. Prior period figures have been re-grouped/re-arranged, where necessary.
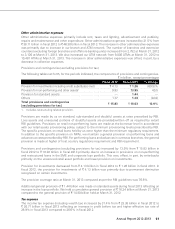
Key ratios
The following table sets forth, for the periods indicated, the key financial ratios.
Particulars Fiscal 2012 Fiscal 2013
Return on average equity (%)111.09 12.94
Return on average assets (%)2,3 1.44 1.66
Earnings per share (`) 56.11 72.20
Book value per share (`) 524.03 578.25
Fee to income (%) 36.86 31.11
Cost to income (%)442.91 40.49
1. Return on average equity is the ratio of the net profit after tax to the quarterly average equity share capital and
reserves.
2. Return on average assets is the ratio of net profit after tax to average assets. The average balances are the
averages of daily balances, except averages of foreign branches which are calculated on a fortnightly basis.
3. We have modified our presentation of mark-to-market gains and losses on foreign exchange and derivative
transactions to gross basis, which was previously on net basis. Accordingly, for fiscal 2012 and fiscal 2013, the
average total assets/total liabilities have been grossed up.
4. Cost represents operating expense excluding lease depreciation. Income represents net interest income and
non-interest income and is net of lease depreciation.
Management’s Discussion & Analysis